Measuring the coefficients of static and kinetic friction
In this laboratory you will measure the coefficient of static and the
coefficient of kinetic
friction for a wood block and a felt-covered block in contact with a metal
track. The surface of the track makes an angle θ with the horizontal.
For angles θ > θmax the block will accelerate down the sloping
track.
You will determine the angle θmax for which the maximum force of
static friction fs_max = μsN = μsmg
cosθmax just cancels the
component of the gravitational force fg = mg sinθmax
pointing down the track. You will then solve for the coefficient of static
friction μs.
With the track at an angle θ > θmax you will measure the
angle of the track and the acceleration of the block as it moves down the track.
The net force on the block has magnitude
F = mg sinθ - μkmg cosθ)
and is pointing down the slope, so the acceleration of the block is
a = F/m = g(sinθ - μkcosθ).
You will solve for the coefficient of kinetic friction μk.
Open a Microsoft Word document to keep a log of your procedures and your results. This log will form the basis of
lab report. Address the points highlighted in blue.
Answer all questions.
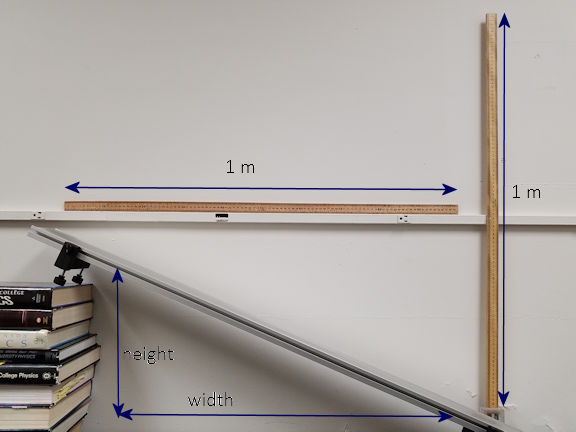
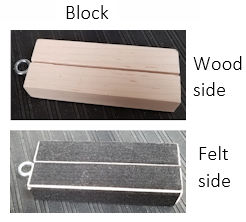
Pictures of the track and the wood block are shown below. The block has
a mass of 112.4 g and one side of the block is covered with felt. A
horizontal and a vertical meter stick are taped to the wall behind the track and
can be used to calibrate the video clips.


Experiment 1
Find the coefficient of static friction.
- You will examine two video clips. In each clip the angle the track
makes with the horizontal slowly increases. Stop the clip when the block
starts moving and step up or down frame-by-frame to get to the frame just before
the block first moves.
- Measure the angle the track makes with the horizontal in this frame.
Use a protractor or use a ruler and measure the width and height of a triangle
and use tanθ = height/width. Determine μs for the wood block and the felt-covered block.
To play or step through the video clips frame-by-frame click the buttons
below.
Construct a table as shown below. Insert this table
into your log.
| surface |
θmax (deg) |
μs |
| wood |
|
|
| felt |
|
|
Experiment 2
Find the coefficient of kinetic friction.
You will examine two video clips.
Determine the position of the block in each clip as a function of time by stepping through the video
clip frame-by-frame and by reading the time and the position coordinates of the
block off each frame. Construct a spreadsheet with columns for time and
position and use this spreadsheet to find the acceleration of the block.
Use the experimental value for the acceleration to determine μk for the wood block and the felt-covered block.
Procedure:
To play or step through video clips frame-by-frame click the
buttons below. The "Video Analysis" web page
will open.
- "Play" the video clip. When finished, "Step up" to frame 1.
- In the setup window choose to track both
coordinate of the object.
- Click "Calibrate".
- Click "Calibrate X".
The video clip contains
two meter sticks. Position the cursor over left end of the horizontal stick and click the left mouse button. Then position the cursor
over the right end of the horizontal stick and click the left
mouse button again. This will record the y-coordinates of the chosen
positions. Enter the distance between those positions into the text box in
units of meter. For the example positions, you would enter 1 into the
text box. Click "Done".
Make sure the video frame stays fixed in the browser window between the two
clicks. You may have to scroll after the clicks to get to the buttons.
- Now click "Calibrate Y".
Position the cursor over bottom end of the vertical stick and click the left
mouse button. Then position the cursor over the top end of the vertical
stick and click the left mouse button again. This will record the
y-coordinates of the chosen positions. Enter the distance between those
positions into the text box in units of meter. For the example positions,
you would enter 1 into the text box. Click "Done".
Make sure the video frame stays fixed in the browser window between the two
clicks.
- Click the button "Click when done calibrating". A spreadsheet
will open up. Click "Start taking data".
- Start tracking the block. Position the cursor over a rear corner of the
block. When you click the left mouse button, the time and the x- and
y-coordinates of this block corner will be entered into the spreadsheet. You will automatically
step to the next frame of the video clip. Make sure the video frame stays
fixed in the browser window while you take data. When the block reaches
the bottom corner of the track, click "Stop Taking
Data".
- Your table will have 3 columns, time (s), x (m), and y (m).
- Open Microsoft Excel, and paste the table into an Excel spreadsheet. (Paste
Special, Unicode Text)
- Produce a plots of x (m) (vertical axis) and y (m) versus time (s) (horizontal axis).
Label the axes.
- For each of the plots eight-click the data and choose "Add Trendline". Choose Polynomial, Order 2, and under options click "Display equation on
chart". An equation of the form y = b1x2 + b2
x + b3 will be displayed where b1, b2, and b3
are numbers.
- For motion with constant acceleration the x-component of the position
varies with time as x = x0 + v0t + (1/2)at2. Since we are plotting x versus t, the number b1 is the best
estimate for ax/2 from the fit. Therefore the value of the acceleration
determined from the fit is ax = 2b1. The same hold
for the y-component.
- insert your plots into your log.
- Find the acceleration of the block in each clip by calculating (ax2
+ ay2)1/2.
- Measure the angle the track makes with the horizontal. You can use the
picture of the track shown near top of this page, since the video clips were
recorded with the track at that angle.
- Determine μk for the wood block and the felt-covered block.
- Construct a table as shown below. Insert this table
into your log.
| surface |
acceleration(m/s2) |
θ (deg) |
c. of kinetic friction μk |
| wood |
|
|
|
| felt |
|
|
|
- Compare the coefficients of static and kinetic friction for
the two surfaces. Comment on your results. Do they make sense?
- How good do you think are your results? What factors do you think may
be responsible for the largest uncertainties?
Experiment 3
Rub your hands together and describe what you feel.
Write down what you think is happening.
Open the Friction simulation.
What do you observe as you rub the two books together? Hit RESET to do
this several times.
Does what you observe in the simulation agree with what your thought was
happening when you rubbed your hands together?
Convert your log into a lab report.
Name:
E-mail address:
Laboratory 5 Report
- In one or two sentences state the goal of this lab.
- Insert your log with the requested graphs and the answers to the
questions in blue font.
Save your Word document (your name_lab5.docx), go to Canvas, Assignments, Lab
5, and submit your document.


