Analyze each of the clips to find the period of oscillation. Track the point where the mass attaches to the spring.
Example:
For the video clip spring_1.mp4, track the y-coordinate of the point where the mass attaches to the spring.
You
can calibrate the data, because there is a meter stick in the picture. From 30
cm to 40 cm is 0.1 m.
The mass of the object is its weight divided by g,
m = (0.4/9.8)kg.
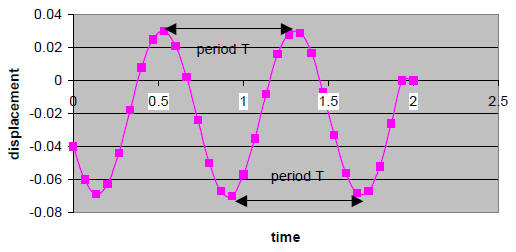
To find the period, plot the displacement versus time.
Find the time interval between a crest and the following crest, or between a trough
and the following trough.
In the example this time interval is approximately
T = (1.33 s - 0.53s) = 0.8 s.
So we have:
| Video Clip | mass m (kg) | period T(s) | T2 (s2) |
| 1 | 0.4/9.8 | 0.8 | 0.64 |
| 2 | |||
| 4 | |||
| 4 |
Do the same for the other clips.
Then plot T2 versus m, (m on x-axis, T2 on y-axis).
Find the slope of the best fitting straight line to this plot. This slope
equals 4π2/k. Solve for k.
To find the slope you can use the Trendline.
To find the uncertainty in the slope you must use the regression function. For
the input y-range choose the entries in the T2 column. For the input
x-range choose the entries in the mass column