Motion with constant velocity
Let us assume that a cart is moving with constant speed of 2 m/s in the positive x-direction and that at t = 0 it passes through the
origin.
We can represent this motion in various ways.
We may use a formula and write
v = ∆x/∆t, xf - xi = v*(tf
- ti).
If we choose our coordinate system so the cart is at position x = 0 at time t = 0, then x(t) = v*t.
We say that the position x increases linearly with the time t, x = (2 m/s)*t.
We can construct the table below.
| Time (t) |
Position
(x) |
| 1 s |
2 m |
| 2 s |
4 m |
| 3 s |
6 m |
| 4 s |
8 m |
| 5 s |
10 m |
Diagrams can also represent the
motion. One type of motion diagram is a ticker-tape diagram. A stationary "ticker" makes a mark at
regular time intervals. A moving object drags a tape past the ticker,
and a trail of marks is left on the tape. For an object moving with
uniform velocity the marks are spaced uniformly on the tape.

Link:
Ticker Tape Diagrams
A vector diagram can also describe
the motion of our cart. At evenly-spaced time intervals we depict the
relative magnitude and direction of a vector quantity, such as the velocity.
For an object moving with uniform velocity, the vectors all have the same
length and the same direction.

Link:
Vector Diagrams
We may also represent the motion using a position
versus time graph or a velocity versus time
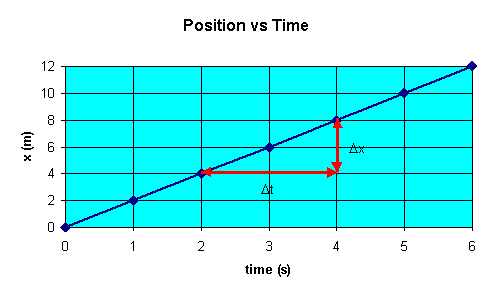
graph. A position versus time for our cart is shown below.
The instantaneous velocity v(t) = dx/dt is equal to the slope of the position versus time graph at time t.

For motion with uniform velocity in one dimension the position versus time
graph is a straight line. The slope dx/dt
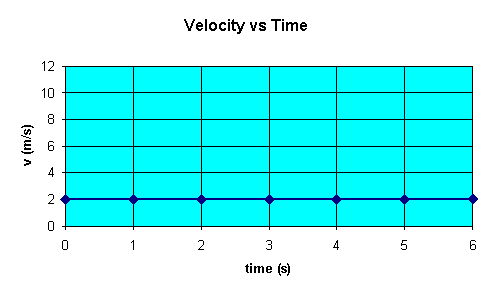
of this straight line is equal to v. The velocity versus time graph
yields a straight line with zero slope. A velocity versus time graph for our
cart is shown below.

Problem:
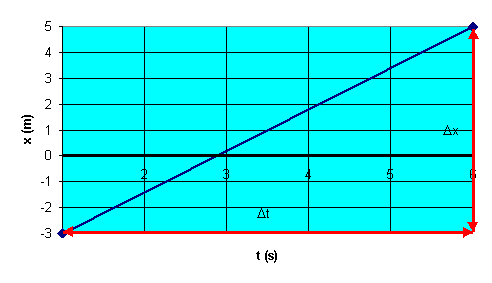
At t = 1 s, a particle moving with constant
velocity is located at x = -3 m, and at t = 6 s the particle is located at x = 5 m.
(a) From this information, plot the position as a function of time.
(b) Determine the velocity of the particle from the slope of this graph.
Solution:
- Reasoning:
For motion with uniform velocity in one dimension the position versus time
graph is a straight line. The slope ∆x/∆t of this straight line is equal
to v.
- Details:
(a) When the velocity is constant, the instantaneous velocity is
equal to the average velocity.

(b) The average velocity
of the particle is
v = (xf - xi)/(tf
- ti) = (5 m - (-3m))/(6s - 1 s) = (8/5) m/s.
Motion with non-uniform velocity
When an object moving in one dimension is accelerating, then
- on a ticker tape diagram the marks are NOT spaced uniformly,
- in a vector diagram the velocity vectors do NOT all have the same length
and direction,
- the position versus time graph is NOT a straight line,
- the velocity versus time graph is NOT a straight line with
zero slope.
Links:
Position versus time graphs
Velocity versus time graphs
Motion with constant acceleration in one dimension
Let us assume at t = 0 a cart is leaving the origin with zero initial
velocity and constant acceleration of 2 m/s2 in the positive x-direction. Then
a = ∆v/∆t, vf
- vi = a*(tf - ti).
If the cart has velocity v = 0 at time t=0, then
v(t) = a*t.
We may say that v increases linearly with the time t, v= (2 m/s2)t.
We can construct the table below.
| t |
vx |
| 1 s |
2 m/s |
| 2 s |
4 m/s |
| 3 s |
6m/s |
| 4s |
8 m/s |
| 5 s |
10 m/s |
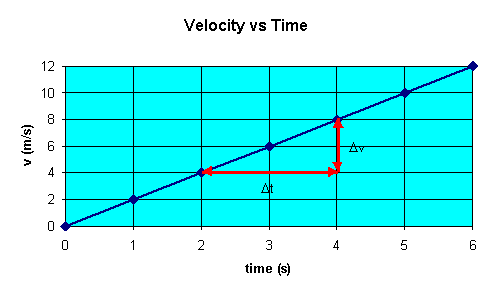
A velocity versus time graph for the cart is shown below.
The instantaneous acceleration a(t) = dv/dt is equal to the slope of the velocity versus time
graph at time t.

For motion with constant acceleration in one dimension the velocity versus
time graph is a straight line. The slope of this straight line yields a.
The acceleration versus time graph yields a
straight line with zero slope.
Note: When representing motion using a graph, make sure you label the
axes properly. When presented with a motion graph first look at the
axes to identify what is plotted.
Summary:
We can represent one-dimensional motion using a position
versus time graph or a velocity versus time
graph.
Position versus time graph:
The slope gives the instantaneous velocity. (vx = lim∆t-->0∆x/∆t
)
Positive slope --> positive velocity
Negative slope --> negative velocity
Constant slope --> constant velocity
Changing slope --> acceleration
(The position versus time graph of motion with constant acceleration is a
section of a parabola.)
Velocity versus time graph:
The slope gives the instantaneous acceleration. (ax = lim∆t-->0∆vx/∆t
)
Positive slope --> positive acceleration
Negative slope --> negative acceleration
Constant slope --> constant acceleration


