Sound
Vibrating objects can produce sound. Sound waves are longitudinal
waves. They can travel through solids, liquids and gases. In this
laboratory you will visualize the patterns of pressure variations associated
with different sounds traveling through air and you will examine the frequency
content of those patterns. You will also produce standing sound waves in a
tube and measure the speed of sound waves in air.
Equipment needed:
- sound sensor
- resonance tube
- tuning forks and rubber block
- thermometer
Open a Microsoft Word document to keep a live journal of
your experimental procedures and your results. Include all deliverables,
(data, graphs, analysis, outcome). Write a 'mini-reflection' immediately
after finishing each investigation, experiment or activity, while the logic is
fresh in your mind.
Exercise 1
Produce a sound pulse by clapping your hands once.
- What do your hands do to produce this sound?
- How does the sound reach your ears?
Sound is a pressure variation that propagates through a
gas or solid.
Consider a long, gas-filled cylinder with a piston on one end.
- (a) The pressure is uniform throughout the
cylinder. Denote this pressure by P0.
- (b) The plunger is pushed quickly into
the cylinder. This causes a compression of the gas molecules near the plunger.
- (c) The plunger is quickly pulled back out of
the cylinder. This causes a rarefaction of the gas molecules near the plunger.
- (d) The compression/rarefaction pattern moves down the cylinder.
Note: While the pressure variation travels down the
cylinder, the gas particles do not. They move back and forth over a
relatively small distance.
Sketch pressure in the cylinder as a function of position along the cylinder axis for the figures (a) and (b) to the right.
This
Word document
contains the figures. You can sketch in Word with a pen or mouse, or print
out the document, sketch, and then take a picture.
Exercise 1 Deliverables:
(to be included in the your journal)
Experiment 1
Most sounds we hear are not single sound pulses but more complex sound
patterns. We will now explore some of those sound patterns.
(a) Compare the output of a sound sensor (microphone) for a clapping and a
humming sound. The sound sensor is an electrets condenser microphone which
converts pressure variations into voltage variations which can be recorded and
displayed by the computer.
- Before you hum into the microphone, sketch what you think a pure tone looks
like versus a complex human sound. Then perform the experiment.
- Make sure the Pasco 850 interface is turned on. Open the Capstone program.
- Plug the Pasco sound sensors into Analog Channel A of the interface.
- Click Hardware Setup, Analog Channel A and choose to add sound sensor.
- Set the sample rate to 10 kHz.
- Drag the "Graph" icon onto the page.
In Continuous Mode, collect sensor voltage (Sound Intensity (V)) versus time data for a single clap
and for a continuous humming sound, for example "ahhhh".
Adjust the voltage and time scales to zoom in so you can see more details.
- Delete the "Graph" display and delete all data runs.
Drag the "Scope" icon onto the page. Measure sensor voltage
(Sound Intensity (V)) versus time.
- Reset the sample rate to 10 kHz. Choose Fast Monitor Mode.
- Press "Monitor" and again hum into the sensor.
- Adjust the "time and voltage scales until you get
a good display of several cycles of the signal.
- When you have a stable signal click the Stop button. Capture the
graph.
Question 1
Describe some of the characteristics of the captured sound
pattern. How did your actual human sound pattern differ from your
prediction? Does your humming sound have a definite frequency?
What does this tell you about the purity of a human sound compared to a sine
wave? How do you justify your answer?
(b) Capturethe output of a sound sensor for the
sound produced by a tuning fork.
- Pick a tuning fork. Strike the tuning force against a rubber block. Never strike the fork
against a hard material. Monitor the sound produced by the tuning
fork with the sound sensor and display the output on the Scope.
- Adjust the "time and voltage scales until you get
a good display of several cycles of the signal.
- When you have a stable signal click the Stop button. Capture the
graph.
Question 2
Describe the captured pattern. Does the tuning fork produce a pure sine
wave? How does the waveform of the tuning fork sound compare to the
waveform of the humming sound?
(c) Any wave pattern can be produced by
superimposing the appropriate sinusoidal waves. Breaking up the
original sound wave into its sinusoidal components is called Fourier analysis. We can find the
frequencies and amplitudes of the sine and cosine waves that must be added to
produce our sound wave. We will choose the "Fast Fourier Transform" or FFT
display to let Capstone perform Fourier analysis on a sound.
Question 3:
What frequencies are strong in your
"ahhh" sound? Without changing the pitch of your voice, change the sound
from "ahhhh" to "eeee". What happens to the frequencies shown in the FFT
display?
Experiment 1 Deliverables:
(to be included in the your journal)
Experiment 2
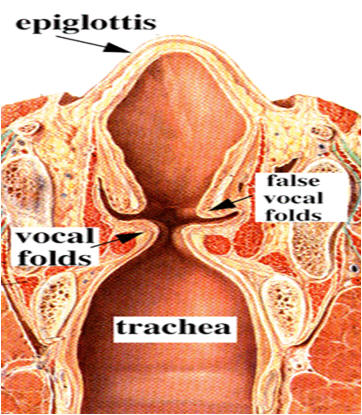 When you produce a sound, air from the lungs is pushed
through the vocal folds. This produces a train of air pulses.
As you speak, muscles in your larynx tighten the vocal folds. When
air from your lungs passes through the folds, they vibrate.
Vibrations at the resonance frequencies have the largest amplitudes. The
tighter the vocal cords, the higher are the resonance frequencies and
the higher is the pitch of your voice.
When you produce a sound, air from the lungs is pushed
through the vocal folds. This produces a train of air pulses.
As you speak, muscles in your larynx tighten the vocal folds. When
air from your lungs passes through the folds, they vibrate.
Vibrations at the resonance frequencies have the largest amplitudes. The
tighter the vocal cords, the higher are the resonance frequencies and
the higher is the pitch of your voice.
The pulse train produced by the
vocal folds is shaped by the resonances of the vocal tract. The
vocal tract acts like a variable filter. It is a filter because it
amplifies certain frequencies and suppresses others. It is
variable because by changing the position of your tongue, jaw, lips,
etc. you can change the overall frequency response.
Link: The Human Voice
Optional: Develop a hypothesis to explain the frequency pattern observed when you make the "ahhh" sound.
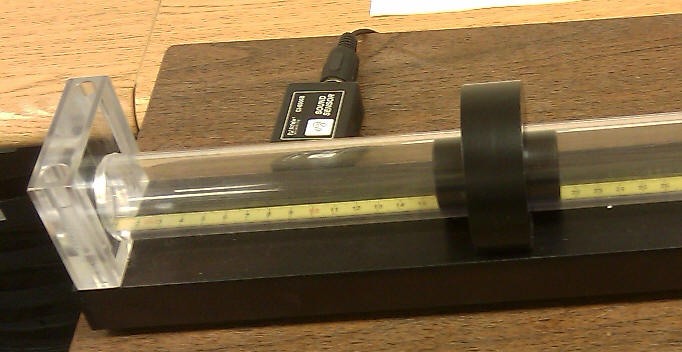
You will now use a resonance in a tube as a variable filter.
The tube has one open and one closed end. The length of the tube can be
varied by moving a piston. You will produce resonances for a fixed
frequency by varying the length of the tube.
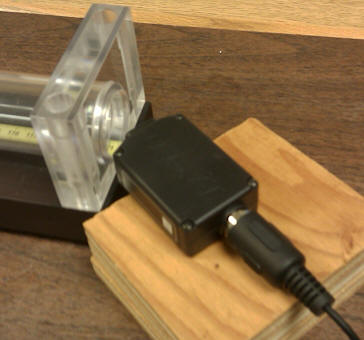
- Position the sound sensor close to the open end of a
resonance tube.
- Click the Monitor button and monitor the oscilloscope and the FFT display.
- Pick a tuning fork. The frequency f with which it oscillates is
stamped on the fork. Hold the rubber block still and strike the tuning
fork against it.
- Hold the fork near the open end of the resonance tube.
Start with a zero-length tube and move the piston
until you find the 1st harmonic.
You will hear the loudest sound and you will also see the maximum peak
voltage on the oscilloscope display.
- Record the tube length for the 1st harmonic in table 1.
- Does the frequency f of the sound you read of the FFT display agree with
the frequency stamped onto the tuning fork?
- Move the piston until you find the 3rd harmonic. Record the tube
length for the 3rd harmonic in table 1.
- Can you find the 5th harmonic? If yes, record the tube length for
the 5th harmonic in table 1.
- Measure the air temperature and record it in table 1.
- Repeat the experiment with a different tuning fork.
Table 1 (tube length)
| |
1st harmonic |
3rd harmonic |
5th harmonic |
frequency (Hz) |
temperature oC |
| fork 1 |
|
|
|
|
|
| fork 2 |
|
|
|
|
|
Analyze your data and complete table 2.
Table 2
| |
frequency f |
wavelength λ |
temperature TC |
speed
v = λf |
| fork 1 |
|
|
|
|
| fork 2 |
|
|
|
|
Compare your experimentally obtained value for the speed of sound with the
value obtained from the formula
v = (331.4 + (0.6/oC)TC) m/s.
Experiment 2 Deliverables:
(to be included in the your journal)
-
Visuals: Tables 1 and 2,
-
Analysis: If we filled the resonance tube with Helium
(which is less dense than air) instead of room air, would you expect the
resonance lengths to be longer or shorter for the same 741 Hz tuning fork?
Justify your answer using the relationship between wave speed, frequency,
and wavelength.
-
Result: Your measured speed of sound in air from experiment 2.
Experiment 3
In the previous experiment you measured the speed of sound
by measuring the wavelength and frequency of a sinusoidal wave and
using v = λf. In this experiment you will measure the speed of sound directly.
- Delete the Scope and the FFT display and drag the "Graph" icon onto the page.
- Reset the sample rate to 10 kHz. Choose Continuous Mode.
Move the piston as far as possible to one end of the
resonance tube. Set up the microphone at the open end of the tube.
Your goal is to record the sound of your fingers snapping and then the echo of
the snap after it has traveled the length of the tube and back.
-
What data must you collect in this experiment to measure the speed of sound in the tube?
- Estimate the time interval between the original sound and the echo reaching the sensor.
- Using your collected data, calculate the speed of sound in the tube.
- Repeat your measurement at least five times.
Experiment 3 Deliverables:
(to be included in the your journal)
Convert your log into a lab report.
Name:
E-mail address:
Laboratory 12 Report
- Make sure you completed the entire lab and answered all parts. Make
sure you show your work and inserted and properly labeled relevant tables
and plots in your journal.
- Add a summary reflection at the end of your report in a short essay format.
Save your Word document (your name_lab12.docx), go to Canvas, Assignments, Lab
12, and submit your document.