Newton's laws
In this laboratory, you will perform a series of
experiments that demonstrate Newton's laws of motion.
Equipment needed:
- Tennis ball
- Track
- Two wireless smart carts
- Electronic balance
Open a Microsoft Word document to keep a live journal of
your experimental procedures and your results. Include all deliverables,
(data, graphs, analysis, outcome). Write a 'mini-reflection' immediately
after finishing each investigation, experiment or activity, while the logic is
fresh in your mind.
Newton's 1st Law
"When viewed in an inertial reference frame, an object
at rest remains at rest and an object in motion continues in motion with constant
velocity unless it is acted on by an external
net force."
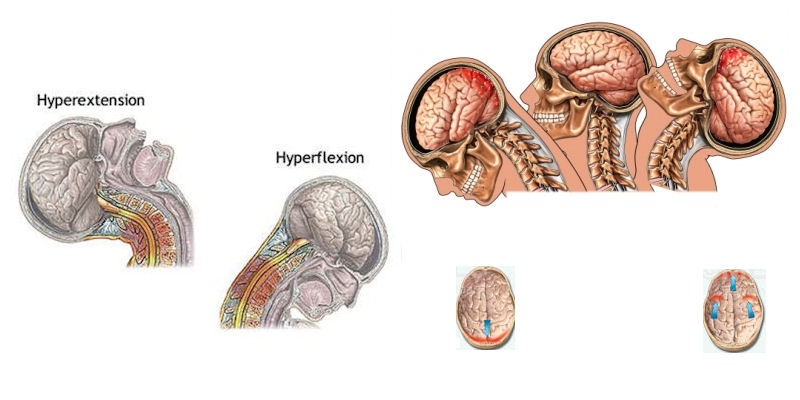
Assume that you sitting in your stopped car with your
seatbelt fastened waiting for a green light. Another car suddenly hits
your car from behind. After recovering from the surprise, you notice a
pain in your head and neck.
- What do you think happens to
the head of a buckled-up driver when the car is hit from behind.
Now assume you are a passenger in a moving car and this car hits the back of a stopped car.
- What do you think happens to the head of a
buckled-up passenger in a moving car when the car hits a stopped car.
Experiment 1: Investigating whiplash as a consequence of
Newton's first law
Place a ball on a book that you hold out in front of you
like a tray with one hand. Record what happens to the ball when you conduct the
following three experiments.
- From rest, walk quickly forward.
- From rest, walk quickly backwards.
- Walk forward at a steady pace, keeping the ball on the
book with your other hand. Let go of the ball while walking steadily.
Then stop suddenly.
Ask an AI to explain the physics of
whiplash in a rear-end collision using Newton's First Law. Where does the
brain experience trauma?'
Compare the AI's explanation with your observations from the ball-and-book
experiment. Did the AI miss any nuances? Did the ball 'whiplash' in
the way the AI described the head moving?"
Reconsider the situation where a stopped car is hit from behind by a moving car.
- Using Newton's First Law, predict what should happen to the head of the
buckled-up driver in the stopped car. Where should the brain trauma
occur in this type of accident?
- Using Newton's First Law, predict what should happen to the head of the
buckled-up passenger in the moving car. Where should the brain trauma
occur in this type of accident?

Experiment 1 Deliverables:
(to be included in the your journal)
-
Analysis: Connect
the "head and car" scenario to the "ball and book" physical model.
What part of your experiment (ball, book, or hand) represented the driver's
head, and what represented the car's seat? Explain why whiplash is an
'inertia' problem rather than a 'force' problem
-
Outcome: Your
observations of the ball during the three walk experiments.
Newton's 2nd law
Experiment 2: Testing the relationship between acceleration and
force
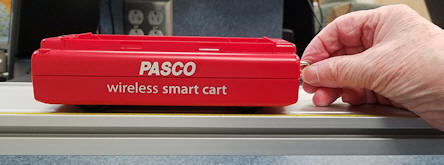
 You will use the Pasco Wireless Smart Cart to make measurements. The
Smart Cart is a cart equipped with a position decoder, a force sensor, an
accelerometer and a gyroscope. The force sensor measures the force along
the rolling direction that is applied to the place where the hook attaches.
The 3-axis accelerometer measures x, y, z components of acceleration of the
cart.
You will produce a graph of the horizontal force applied to the cart versus
the horizontal acceleration of the cart. For this experiment, you will use
a red Smart Cart with a hook attached. Close the Hardware Setup window.
- Press the power button on the side of the Smart Cart to turn it on.
- In Capstone, click Hardware Setup. Under available devices, you
should see your Smart Cart. If you see more than one cart, refer to
the label your cart to add the correct one. Choose to measure Force
(N) and Acceleration - x, (m/s2).
- Create a Graph Display by dragging the Graph icon onto the main display. Select
Force, (N) for the y-axis and Acceleration - x, (m/s2) for the x-axis.
- Place the cart in the middle of your track. Make sure the track is
level and the cart stays at rest.
- In the sampling control panel, press the "Zero Sensor" button for each
sensor. (Always zero a the sensors with the cart at rest before a
measurement.)
-
 Before you collect data, practice rolling the cart in a forwards and backwards
motion by only holding on to the hook. You want to apply a force along the
cart's x-axis, and have the cart roll only along this direction. Try not
to wiggle or knock the Smart Cart hook as this will result in extraneous
data points.
- Press the record data button.
- Holding only the hook, roll the Smart Cart forwards and backwards in the
x-direction.
- Repeat this motion at least 4 times to generate enough data points.
- Stop data collection.
- Turn on the "Linear Fit" tool. The software will calculate the
equation for the best-fitting straight line, F = max + b, to the
data points and display the fitting parameters on the screen.
-
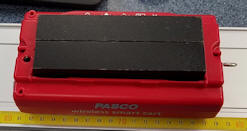
 Add two metal blocks to your cart and repeat data collection and analysis for
this new system.
What value did you obtain from this
measurement for the mass of this system?
- Use a digital balance and weigh the cart with and without the metal blocks.
The scale is calibrated in kg, so it displays the mass using weight = mg.
Experiment 2 Deliverables:
(to be included in the your journal)
-
Visuals: Labeled
plots (including fit) of force versus acceleration.
-
Analysis: How do you
use the mathematical fit y = ax + b to your data to extract physical
constants (mass and frictional force)? Compare the masses obtained
from your force and acceleration measurements with those obtained using the
scale. Comment on your results. Are they reasonable? What
are possible sources of error?
-
Outcome: Your best estimate for the mass of the cart with
and without metal blocks from the fit.
Activity: Measuring the acceleration while riding an
elevator
The acceleration of the old elevator in the Nielsen Physics Building was
measured as it traveled from the second to the sixth floor, starting from rest.
The data were taken using the acceleration sensor in a cell phone.
Open the
linked Excel
Spreadsheet.
- Produce a Graph of acceleration versus time.
The phone recorded a data point every 0.15 s.
- Use ∆v = a*∆t to find the velocity of the elevator
as a function of time.
Into cell C3 type "=C2+B2*0.15". Copy the formula into the
other cells of column C.
- Use ∆y = v*∆t to find the position of the elevator
as a function of time.
Into cell D3 type "=D2+C2*0.15". Copy the formula into the
other cells of column D.
- Produce a graph of velocity versus time and a graph of position versus time.
Discuss with your partners what these graphs tell you.
Explain in detail how to relate the information in the graphs to a ride
in an elevator.
Activity Deliverables: (to be included in the your journal)
-
Visuals: Labeled
plots of velocity and acceleration versus time.
-
Analysis: Discuss with your partner what these graphs
tell you. Explain in detail how to relate the information in the
graphs to a ride in an elevator.
Newton's 3rd Law
Experiment 3: Testing the law of action and reaction
You will use two carts with force sensors.
- Delete all your data runs.
- Turn on the blue Smart Cart. Add it to your devices under Hardware
Setup. Choose to measure Force (N).
- Add a plot to your graph. For the x axis of both plots choose
time. For the y axis of one plot choose Force, Red (N) and for the
other plot choose Force, Blue (N).
- Connect the force sensor hooks with two rubber bands.

- Zero both force sensors.
- Start taking data.
- Pull the carts apart with varying amounts of force. You can hold
one cart fixed and pull on the other cart, or you can pull on both carts.
Do not pull too hard to avoid breaking something. The force sensors
read a positive force when pulled and a negative force when pushed.
The magnitude of the maximum force they can tolerate is 100 N.
- Compare the two plots.
Discuss your observations with your partner. Interpret your
results in terms of Newton's third law.
- Start a new data run.
Push the carts together with varying amounts of force, hook against hook..
- Compare the two plots. Discuss your observations with your partner.
Interpret your results in terms of Newton's third law.
Challenge an AI with a common
misconception: 'If a giant truck hits a tiny parked car, Newton's third law
says the forces are equal. But the car is crushed and the truck is fine.
Explain this paradox.'
Experiment 3 Deliverables: (to be included in the your journal)
Before you leave, please plug the carts into USB ports of a
computer to keep them fully charged for the next group of students.
Convert your journal into a lab report.
Name:
E-mail address:
Laboratory 2 Report
- Make sure you completed the entire lab and answered all parts. Make
sure you show your work and inserted and properly labeled relevant tables
and plots in your journal.
- Add a summary reflection at the end of your report in a short essay format.
Save your Word document (your name_lab2.docx), go to Canvas, Assignments, Lab
2, and submit your document.
 You will use the Pasco Wireless Smart Cart to make measurements. The
Smart Cart is a cart equipped with a position decoder, a force sensor, an
accelerometer and a gyroscope. The force sensor measures the force along
the rolling direction that is applied to the place where the hook attaches.
The 3-axis accelerometer measures x, y, z components of acceleration of the
cart.
 Before you collect data, practice rolling the cart in a forwards and backwards
motion by only holding on to the hook. You want to apply a force along the
cart's x-axis, and have the cart roll only along this direction. Try not
to wiggle or knock the Smart Cart hook as this will result in extraneous
data points.
 Add two metal blocks to your cart and repeat data collection and analysis for
this new system.