Extended objects can have translational and rotational motion. To describe the motion of an unconstrained object, such as a football in flight, it is most convenient to treat the motion as a combination of translational motion of the center of mass and rotational motion about the center of mass. The motion of an object constrained to rotate about a fixed axis, such as a door rotating about a vertical axis defined by its hinges, is often more conveniently described as a pure rotation about this axis. If this axis is not a symmetry axis, the object then exerts a force on the axis, and an external force is required to keep the net force on the axis zero and the axis fixed.
In this session, we will become familiar with describing rotational motion. We will investigate the relationships between angular acceleration, moment of inertia, angular momentum and torque. Finally, we will construct and examine a simple model of a forearm.
Equipment needed:
Open a Microsoft Word document to keep a live journal of your experimental procedures and your results. Include all deliverables, (data, graphs, analysis, outcome). Write a 'mini-reflection' immediately after finishing each investigation, experiment or activity, while the logic is fresh in your mind.
Experiment 1
Have one person in your group stand up and make a fist. This person should then gently swing their arm in a vertical circle, pivoting at the shoulder and keeping the rest of the arm straight. Observe the motion of the arm. Pay attention to the motion of the elbow and of the hand.
Make the following measurements and record the data in your log:
Use your data to answer the following questions.
Motion of the hand
What was the average centripetal acceleration (m/s2) of the hand?
Motion of the elbow
Which quantities are different and which quantities are the same for the hand and the elbow? Discuss your answers with your partner and write down questions if you have any.
Experiment 1 Deliverables: (to be included in the your journal)
Results: Results of your measurements.
Optional Experiment
Open the Phyphox app on your phone. Click on the Gyroscope (rotation rate) sensor. This sensor measures your angular velocity ω (both its vector components and its magnitude). Click Absolute, to measure the magnitude.
Sit on a swivel chair and push against the floor for an angular impulse. Once you are rotating start taking data. After two revolutions stop taking data. Use "Pick data" on the last data point of the graph to find the time interval Δt during which you took data. The number below the graph tells you the magnitude of the average angular velocity as measured by the sensor.
Exploration
Use an on-line simulation from the University of Colorado PhET group to
investigate the relationships between angular acceleration, moment of inertia,
angular momentum and torque.
Link to the simulation:
http://phet.colorado.edu/en/simulations/torque
This is a simulation written in Java. Here are instructions on running
Java PhET simulation on a
Windows or
macOS computer.
If you cannot rum Java on your computer, run the simulation via
Cheerpj (the browser compatible version). It takes a long time to load, and it runs slower, but it works.
Click the Intro tab explore the interface.
Click the Torque tab.
Click the Moment of Inertia tab.
Click the Angular Momentum tab.
Exploration Deliverables: (to be included in the your journal)
Visuals: Screenshot of the Intro tab showing the wheel,
the bugs, the velocity and acceleration arrows, while the wheel is spinning,
braking, and coasting.
Screenshot from the torque tab showing the applied force, the direction of
torque, the motion of the ladybug, and the acceleration vector.
Screenshot from the moment of inertia tab showing the torque graph, the
angular acceleration graph, the moment of inertia graph, and the disk with
inner/outer radii visible.
Screenshot from the angular momentum tab showing the angular speed, the
moment of inertia, and changes after adjusting radii or mass.
Analysis:
Intro tab analysis: Describe the direction of velocity and
acceleration arrows when the angular speed is increasing, constant, or
decreasing. Explain why the acceleration arrow behaves differently
from the velocity arrow.
Torque tab analysis: State the magnitude and direction of the torque
for a 1.5 N applied force. Explain what happens to the ladybug and
why. Identify what provides the centripetal force keeping the bug in
circular motion. Explain why the centripetal force eventually fails.
For the 0.5 N force describe how the acceleration vector changes over time.
Explain whether the acceleration vector can ever point directly toward the
center. When braking is applied describe how the acceleration vector
responds and why.
Moment of Inertia tab analysis: Record the measured radius r.
Compute the tangential force component from the measured torque. Use
this to compute the experimental moment of inertia. Compare the
computed value with the graph's displayed moment of inertia. Explain
why the moment of inertia graph stays constant even when the force changes.
Angular Momentum tab analysis: Describe what happens to the moment of
inertia and the angular velocity when the inner radius is changed while the
disk is spinning. Explain how this demonstrates conservation of
angular momentum. Describe what happens when mass, inner radius, or
outer radius are changed.
Results: Based on your exploration, summarize how velocity and acceleration arrows behave in different rotational regimes, how torque affects rotational motion, and how mass distribution affects moment of inertia.
Experiment 2
Take a meter stick with a clip to which you can attach a weight. Grab the stick on one end, and
hold it horizontal, with the weight close to your hand. Then have someone slide
the weight out to other end. Does it become harder to hold the stick
horizontal? Why? You are holding up the same weight.
In this experiment, we will use the meter stick as an artificial forearm.
The arm (excluding the shoulder and wrist) is composed to two major segments. The upper arm is attached to the shoulder. The forearm is attached to the upper arm at the elbow. Let us only concentrate on situations where the upper arm is in the vertical position. Then the forearm can move in two directions, upwards or downwards.
The upper-arm and the forearm can be thought of as two rigid levers, joined at the elbow, which acts as a pivot point. Muscles attached to these levers provide the force required to articulate their motion. Since muscles can only provide force by contraction, they must always work in pairs. As the contracting muscle, (red), tightens, it applies a force to the arm. At the same time, the opposing muscle, (black), relaxes, thus allowing the arm to move. We have a pair of simple levers.
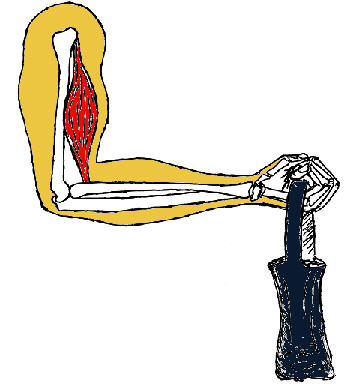
When we lift a load with our biceps muscle, this muscle does positive work.
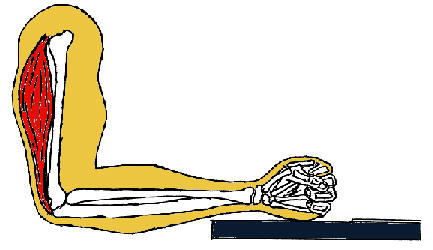
The triceps muscle does positive work when we push down on something.
There is also a third force on the forearm, the force the upper arm's bone exerts on the forearm at the elbow joint. This force does no work, because the elbow joint is not moving.
AI Study Tip:
Example prompt for lab preparation: 'In my physics lab, we are modeling the human forearm as a lever. The elbow is the pivot, the biceps provides an upward force, and a weight is held in the hand. If the arm is in static equilibrium, help me set up the sum of torques equation. How do I account for the weight of the forearm itself acting at its center of mass?'
Procedure:
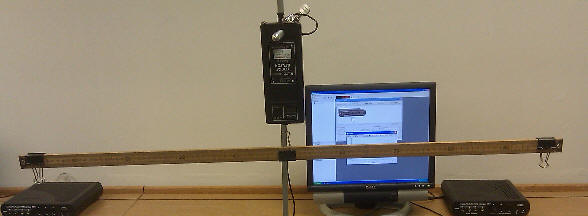
Attach 3 clips to the meter stick, one at each end, and one in the middle as shown in the figure below. Hang the stick from the force sensor. Adjust the position of the center clip so the stick is horizontal. Use the force sensor and Capstone to measure the weight of the stick and the clips. (Always press the tare button on the force sensor before you attach something to the hook to make a measurement.)
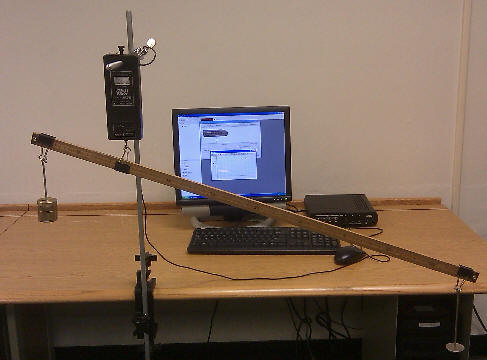
Move the center clip to a position 20 - 25 cm away from the left edge of the stick. Now the stick is no longer horizontal. You have to push down on the left end of the stick to bring the stick to a horizontal position. When you push down on the stick, what happens to the reading of the force sensor?
To find out how hard you have to push down to bring the stick to a horizontal position. Attach a mass hanger to the clip on the left end. Load masses onto the mass hanger until the stick is horizontal. The combined weight of the masses and hanger equals the force with which you have to push down.
Fill in the table below. Record only magnitudes. (Before taking a force reading, remove the stick, press the tare button, and reattach the stick.)
| weight of meter stick and clips | |
|---|---|
| weight suspended from left clip | |
| (optional) weight suspended from right clip | |
| force sensor reading when the stick is again horizontal | |
| distance d from left clip to force sensor hook (pivot point) | |
| distance from force sensor hook to CM of meter stick | |
| distance from force sensor hook to right clip |
Experiment 2 Deliverables: (to be included in the your journal)
Table: Table of experimental results.
Analysis: Modeling the meter stick as a forearm and the force sensor as the biceps, compare the force that the biceps has to exert to keep the forearm horizontal to the force it has to exert to just support the weight of the forearm. Comment on the relative magnitude of these forces.List all the forces (magnitude and direction) acting on the forearm (meter stick) and calculate all the torques (magnitude and direction) exerted by those forces about the pivot point, when the stick is horizontal and in equilibrium. Do all the torques cancel out?
Convert your log into a lab report.
Name:
E-mail address:
Laboratory 6 Report
Save your Word document (your name_lab6.docx), go to Canvas, Assignments, Lab 6, and submit your document.