In this studio session you will investigate some thermometric properties of gases. You will also experimentally investigate a change of phase of water.
Equipment needed:
Open a Microsoft Word document to keep a live journal of your experimental procedures and your results. Include all deliverables, (data, graphs, analysis, outcome). Write a 'mini-reflection' immediately after finishing each investigation, experiment or activity, while the logic is fresh in your mind.
The ideal gas law states that for a fixed volume of an ideal gas (PV/T) = nR = constant. Here P and V are the pressure and volume of the gas at absolute temperature T. Theoretical derivations of the ideal gas law neglect the forces that the gas molecules exert on each other. Real gases therefore do not strictly obey the ideal gas law. However, at sufficiently low densities, intermolecular forces do not play a significant role and the ideal gas law becomes increasingly accurate. For instance, at 20 atm pressure and room temperature, the volume of 1 mole of oxygen gas is about 2.3% smaller than predicted by the ideal gas law, but at 1 atm pressure the volume is only about 0.13% smaller.
Remember:
If an equation in physics contains the temperature T, this temperature is always the absolute temperature. In SI units it is always measured in K. If an equation contains a temperature difference ΔT, this temperature difference can be measured in K or oC in SI units, since both scales give the same ΔT.
Exploration
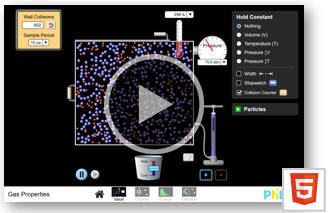
Use an on-line simulation from the University of Colorado PhET group to
explore relations between pressure P, volume V, and temperature T of a gas.
Link to the simulation:
Gas Properties
Click on the "Ideal" link. Explore the interface!
Part 1:
Reset the simulation, choose constant volume and add gas to the chamber at 300 K until the pressure is between
20
and 30 atm.
Switch to constant temperature measure the pressure P as a function of the
volume V.
[The volume of the box is V = depth * height * width. Depth and height are
fixed, so V = constant*width. In the simulation the constant is 35 nm2.
The width can be measured in units of nanometer (nm).]
Vary the width of the box with the handle.
Construct an appropriate data table with at least 6 data points.
Plot of P versus 1/V.
Part 2:
Switch to constant pressure and measure the volume V as a function of
temperature T.
Construct an appropriate data table with at least 6 data points.
Plot of V versus T.
Part 3:
Click the energy link at the bottom of the simulation.
Explore the additional interface options!
Add two species gas to the chamber at 300 K until the pressure
is between 40 and 50 atm.
Compare the average kinetic energies of the
two types of particles.
Compare the average speeds of the two types of particles.
Exploration Deliverables: (to be included in the your journal)
Visuals: Data table and plots for part 1 and part 2
Analysis:
Can you determine the mathematical relationship between pressure and volume from your part 1 plot? Did you verify one of the gas laws? What should your plot look like to verify this law?
Can you determine the mathematical relationship between volume and temperature from your part 2 plot? Did you verify one of the gas laws? What should your plot look like to verify this law?
Substances can exist in solid, liquid or gas phases.
At a constant pressure changes of phase always occur at the same
temperatures for any pure substance.
The temperature is a measure of the
internal, disordered energy of a substance. The
absolute temperature of any substance is proportional to the average
translational kinetic energy associated with the random motion of
the molecules of the substance.
½m<v2> = (3/2)kBT
In SI units the scale of absolute temperature is Kelvin (K). But we use different temperature scales in everyday situations. The Kelvin scale is identical to the Celsius (oC) scale, except it is shifted so that 0 oC equals 273.15 K.
Experiment
Open the Capstone program.


Start with a known quantity of hot water in a large Styrofoam cup. Measure its temperature, and then add ice at its melting temperature (0 oC) until the temperature of the water drops to about 10 oC. Measure the final temperature and determine the amount of ice added. Determine the latent heat of fusion of ice/water using the measured masses and temperatures and value of the specific heat capacity of water.
Procedure:
| mass of cup (kg) | mcup | |
|---|---|---|
| mass of cup + water (kg) | mcup + mw | |
| mass of cup + water + ice (kg) | mcup + mw + mice | |
| mass of water (kg) | mw | |
| mass of ice (kg) | mice | |
| initial temperature of water (oC) | Ti | |
| final temperature of water (oC) | Tf | |
| latent heat of fusion (kcal/kg) | Lf (measured) | |
| latent heat of fusion (kcal/kg) | Lf (accepted) |
Experiment Deliverables: (to be included in the your journal)
Visuals: Data table
Analysis:
Compare your measured latent heat of fusion, Lf, with the accepted value. What are some of the experimental errors that could cause your measured value of Lf to differ from the accepted value? Why is it important to dry the ice before adding it to the water?
Result: Your measured latent heat of fusion Lf.
Discussion
Consider the experiment described below.
A 1.0 kg mass and a 3.0 kg mass with different initial temperatures are placed together inside a well-insulated container and allowed to come to thermal equilibrium. The insulated container prevents any transfer of energy to or from the environment (including the container itself).
| Mass | 1.0 kg | 3.0 kg |
|---|---|---|
| Initial temperature | 100 oC | 160 oC |
| Specific heat capacity | 440 kJ/(kg oC) | 73.33 kJ/(kg oC) |
| Final temperature | 120 oC | 120 oC |
| ΔT | +20 oC | -40 oC |
Questions:
Do you agree or disagree with the following statements? Explain why you agree or disagree.
The human body has the ability to regulate its temperature so that it remains very close to 37 oC. If the body is overheating as a result of strenuous exercise, the surface blood vessels dilate to increase the blood flow to the surface areas. Heat is carried by the blood to the surface where it causes the skin temperature to increase. The body also begins to produce sweat. The rate of sweating increases strongly with body temperature above 37oC.
Conduction, evaporation, convection, and radiation can now transfer heat from the skin to the environment. The chart below shows the relative importance of these heat transfer mechanisms at different environmental temperatures.
Questions:
The body secrets water on to the skin from sweat glands. As this water evaporates, the latent heat of vaporization is removed from the body. The rate of evaporation increases as the degree of saturation of the surrounding air decreases. In warm humid weather, the rate may be so low that a layer of water accumulates on the skin. In still air, the air near the skin will become saturated and evaporation will stop. Evaporation will increase if this saturated air is continually removed by wind or an artificially produced air stream.
Questions:
Discussion Deliverables: (to be included in the your journal)
Questions: Answer the questions concerning each of the rgee topics in the discussion section.
Convert your log into a lab report.
Name:
E-mail address:
Laboratory 9 Report
Save your Word document (your name_lab9.docx), go to Canvas, Assignments, Lab 9, and submit your document.