Work and Energy
Energy conservation for an isolated system is a fundamental principle of
physics. Energy for an isolated system is always conserved. It may change
forms, but the total amount of energy in an isolated system is constant.
Energy can, however, be converted from one form to another form. Work is the conversion of one form of energy into another.
Energy comes in different forms, kinetic energy, potential energy, chemical
energy, thermal energy, etc. If an object has energy, it has the potential
to do work.
There are several forms of potential energy. Kinetic and potential energy
are called mechanical energy or
ordered energy.
Thermal energy is disordered energy. Friction converts mechanical
energy into disordered energy. When no disordered energy is produced, then
mechanical energy is conserved.
Today we will track the mechanical energy in various
systems and explore the relationship between work and energy.
Equipment needed:
- Track
- Smart Cart
- Ruler and metal blocks
- 50 g mass
Open a Microsoft Word document to keep a live journal of
your experimental procedures and your results. Include all deliverables,
(data, graphs, analysis, outcome). Write a 'mini-reflection' immediately
after finishing each investigation, experiment or activity, while the logic is
fresh in your mind.
on.
Experiment 1
A spring‑loaded foam toy gun is a little physics machine hiding in plain
sight. Before performing this experiment, ask an AI how a spring‑loaded
foam toy gun works.
In this experiment you will do work compressing a spring. You will then
let the spring do work converting elastic potential energy into gravitational
potential energy.
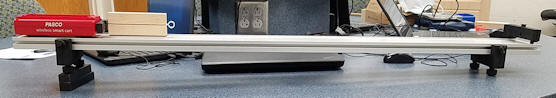
- Set up a track with a bumper to the other end. Place the feet of the track at ~10 cm and ~110 cm and make sure the
leveling screws are turned all the way in.
Note: You will use the track for experiment 2 only.
- Press the power button on the side of the Smart Cart to turn it on.
- In Capstone, click Hardware Setup. Under available devices, you
should see your Smart Cart. If you see more than one cart, refer to
the label your cart to add the correct one. Choose to measure Force
and Position.
- Create a Graph Display by dragging the Graph icon onto the main display.
Select Force, (N) for the y-axis and Time (s) for the x-axis.
 Choose a common sample rate of 50 Hz.
- Place the Smart Cart on its wheels on a level surface and zero the force sensor.
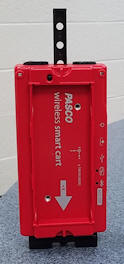
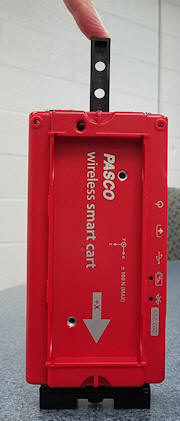
Then set the cart upright on the table on its magnetic bumper. The cart
has a three-position spring plunger, activated by a trigger located on the front-end cap. Release the plunger.
- For a short time record the force sensor reading with the cart just sitting
there. The force sensor reads the weight w of the cart. Record the
weight w. (Take the mean value.)
Note: Because we are pushing on the force sensor, we read a negative value
for the force. Ignore the negative sign and take the absolute value or
magnitude.
-
 Practice exerting a force on the plunger and very slowly pushing it
to the third position without it catching. Then start recording the force as you slowly
push the plunger to the third position in without it catching.
Practice exerting a force on the plunger and very slowly pushing it
to the third position without it catching. Then start recording the force as you slowly
push the plunger to the third position in without it catching.
As you compress the spring, the force increases linearly. Monitor the force
on a graph. Repeat a few times to get a value for the maximum force Fmax required to compress the
spring to the third position. Record Fmax.
Note: You have to subtract the weight w of the cart from the maximum value
you read of the graph to determine the maximum force Fmax required to
compress the spring.
- Use a ruler to measure the distance d the
plunger moved from being released to the third position. Record it.
- The work you do in compressing the spring is W = Faverage
*d. What is Faverage? Why?
- Calculate the work you do to compress the plunger spring all the way in and record it.
-
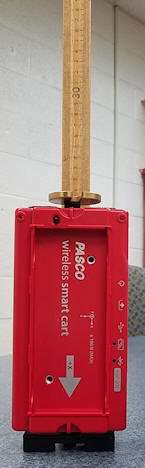 Now place a 50 g mass on top of the plunger.
- Release the trigger and measure with a ruler the maximum height above
its starting position to which the mass jumps. Calculate and record the maximum change in
potential energy of the mass. Repeat a few times to get a reliable
measurement of the maximum height.
- Compare the work done to compress the plunger spring to the maximum change in potential
energy of the mass.
- Was some energy "lost" in the process? If so, where did it go? Elaborate!
Experiment 1 Deliverables:
(to be included in the your journal)
-
Data: Your measurements of Fmax, d, Faverage,
and the height to which the mass jumps. Your calculations of the he
work you do to compress the plunger spring and the the maximum change in the
potential energy of the mass.
-
Analysis: Compare the work done to compress the plunger spring to the maximum change in potential
energy of the mass. Determine what percentage of energy is 'missing' and
identify the culprit.
-
Outcome: The percentage of elastic potential energy
stored in ste spring converted into maximum potential energy of the mass.
Discussion
- Can you jump keeping your legs completely straight? Does the amount of bending of your legs have any
relation to how far up you can jump? Try this out and describe your results.
- From a physics point of view, why does bending your legs help you jump?
Is energy stored in your legs when bent? How do you know?
Experiment 2
In this experiment, you will lift one end of the track. You will then
measure the conversion of gravitational potential energy into kinetic energy.
Before performing the experiment, ask the AI: 'I am dropping a 500 g cart
down a 30-degree ramp. What are three real-world factors that will prevent
my final Kinetic Energy from equaling my initial Potential Energy? Rank
them by how much energy I will likely lose to each.'
Perform the experiment
- Lift the end of the track with without bumper and place the feet on
two stacked metal blocks.
- Place the cart near the elevated end and let it accelerate towards the
bumper.
- Delete all your previous data runs.
- Change the axes of your graph to measure velocity (y-axis) versus position
(x-axis).
Click "Recording Conditions" below the main display.
Choose Start Condition, Measurement Based, Position, is above 0.2 m.
- Choose Stop Condition, Measurement Based, Position, is above 0.8 m.
- Start taking data. Let the cart accelerate. Use the coordinate
tool to determine the cart's speed
when it has traveled 0.2 m and 0.7 m. Record those speeds.
- Measure the difference in the height of the track at positions 0.5 m apart.
Record your measurements.
- Compare the change in the gravitational potential energy of the cart to the
change in its kinetic energy when its distance from the motion sensor changes
from 0.2 m to 0.7 m. Record your calculations.
Experiment 2 Deliverables:
(to be included in the your journal)
-
Data: Your measurements of height and speed and your
calculation of the change in the gravitational potential energy and kinetic
energy of the cart.
-
Analysis: Discuss your numbers in light of the response
you got from the AI.
Exploration
Use an on-line simulation from the University of Colorado PhET
group to track mechanical energy in a skate park.
Link to the simulation:
https://phet.colorado.edu/en/simulations/energy-skate-park-basics
- You can build tracks, ramps and jumps and view graphs of
kinetic energy, potential energy and friction as the skater moves.
(a) Click the Playground image. Explore the interface!
Note:
- You can Pause the simulation and then put the Skater anywhere.
Restart Skater returns the Skater to this spot
and you can rerun the scenario.
- You can fix the skater to the track or let him loose contact with the track.
(b) Design your own frictionless track. You can ask for some
design guidelines in the discussion forum.
- Design a track that is fun, challenging and relatively safe. Use
the Energy Graphs to track the Skater's mechanical energy. Decide
which graphs or charts best help you understand what makes your track
successful.
- Ask an AI: 'I am designing a PhET Skate Park track with a loop.
What is the minimum height the skater must start from to complete the loop
without falling off, and why?' Use the simulation to test the AI's claim. Was the AI was right? Why?
(c) Add friction to your track.
- Explain what changes in the simulation when you add friction.
Paste you explanation of friction into an AI with this prompt: 'I am a
physics student. Here is my explanation of how friction affects energy in a
skate park: [Insert Explanation]. Play the role of a skeptical physics
professor and point out any gaps in my logic or ask me two challenging
follow-up questions. Include the A's "critique" and your rebuttal
in your journal.
Exploration Deliverables:
(to be included in the your journal)
-
Analysis: What makes a successful track in terms of
conservation of mechanical energy? Refer to your conversation with the
AI and Charts or Graphs to explain your reasoning.
-
Outcome: A picture of a successful track with a
loop that you have designed.
Convert your log into a lab report.
Name:
E-mail address:
Laboratory 4 Report
- Make sure you completed the entire lab and answered all parts. Make
sure you show your work and inserted and properly labeled relevant tables
and plots in your journal.
- Add a summary reflection at the end of your report in a short essay format.
Save your Word document (your name_lab4.docx), go to Canvas, Assignments, Lab
4, and submit your document.