Motion with constant velocity
Let us assume that a cart is moving with constant speed of 2 m/s in the positive x-direction and that at t = 0 it passes through the
origin.
We can represent this motion in various ways.
We may use a formula and write
v = ∆x/∆t, xf - xi = v*(tf
- ti).
If we choose our coordinate system so the cart is at position x = 0 at time t = 0, then x(t) = v*t.
We say that the position x increases linearly with the time t, x = (2 m/s)*t.
We can construct the table below.
| Time (t) |
Position
(x) |
| 1 s |
2 m |
| 2 s |
4 m |
| 3 s |
6 m |
| 4 s |
8 m |
| 5 s |
10 m |
We may also represent the motion using a position
versus time graph or a velocity versus time
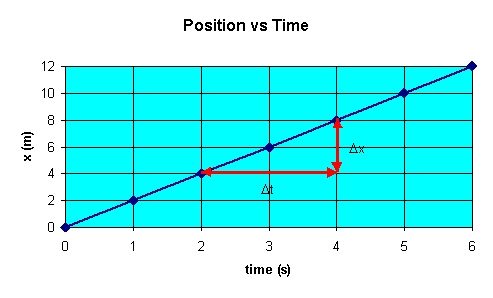
graph. A position versus time for our cart is shown below.
The instantaneous velocity v(t) = ∆x/∆t as ∆t becomes infinitesimally
small is equal to the slope of the position versus time graph at time t.

For motion with uniform velocity in one dimension the position versus time
graph is a straight line. The slope ∆x/∆t
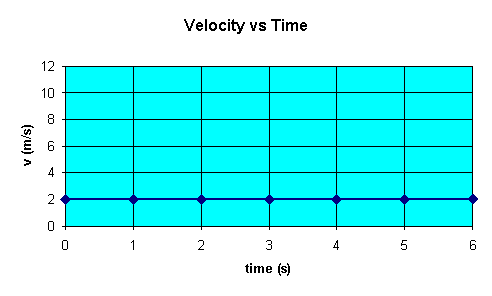
of this straight line is equal to v. The velocity versus time graph
yields a straight line with zero slope. A velocity versus time graph for our
cart is shown below.

Problem:
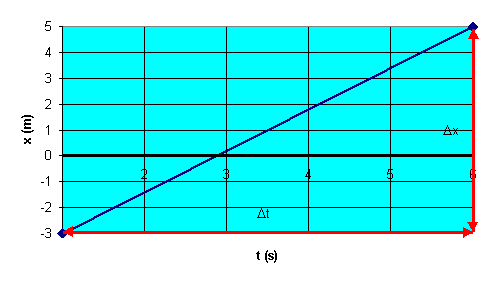
At t = 1 s, a particle moving with constant
velocity is located at x = -3 m, and at t = 6 s the particle is located at x = 5 m.
(a) From this information, plot the position as a function of time.
(b) Determine the velocity of the particle from the slope of this graph.
Solution:
- Reasoning:
For motion with uniform velocity in one dimension the position versus time
graph is a straight line. The slope ∆x/∆t of this straight line is equal
to v.
- Details:
(a) When the velocity is constant, the instantaneous velocity is
equal to the average velocity.

(b) The average velocity
of the particle is
v = (xf - xi)/(tf
- ti) = (5 m - (-3m))/(6s - 1 s) = (8/5) m/s.
Motion with non-uniform velocity
When an object moving in one dimension is accelerating, then
- the position versus time graph is NOT a straight line,
- the velocity versus time graph is NOT a straight line with
zero slope.
External links:
Position versus time graphs
Velocity versus time graphs
Motion with constant acceleration in one dimension
Let us assume at t = 0 a cart is leaving the origin with zero initial
velocity and constant acceleration of 2 m/s2 in the positive x-direction. Then
a = ∆v/∆t, vf
- vi = a*(tf - ti).
If the cart has velocity v = 0 at time t=0, then
v(t) = a*t.
We may say that v increases linearly with the time t, v= (2 m/s2)t.
We can construct the table below.
| t |
vx |
| 1 s |
2 m/s |
| 2 s |
4 m/s |
| 3 s |
6m/s |
| 4s |
8 m/s |
| 5 s |
10 m/s |
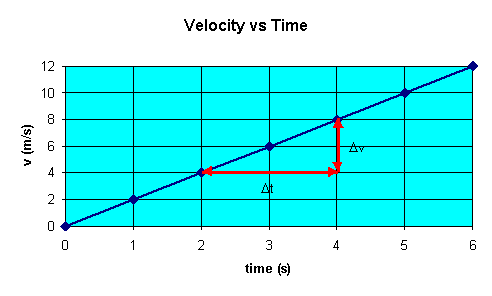
A velocity versus time graph for the cart is shown below.
The instantaneous acceleration a(t) = ∆v/∆t as ∆t becomes
infinitesimally small is equal to the slope of the velocity versus time
graph at time t.

For motion with constant acceleration in one dimension the velocity versus
time graph is a straight line. The slope of this straight line yields a.
The acceleration versus time graph yields a
straight line with zero slope.
Note: When representing motion using a graph, make sure you label the
axes properly. When presented with a motion graph first look at the
axes to identify what is plotted.
AI Study Tip:
Ask an AI to help you translate a graph to a story.
Example prompt: 'Describe a position versus time graph where the line is a
horizontal flat line, then a steep diagonal line, then a curved line opening
upward. Act as a tutor and ask me what the velocity and acceleration look
like for each of those three segments. Don't give me the answers yet, help
me visualize the motion first.'
Summary:
We can represent one-dimensional motion using a position
versus time graph or a velocity versus time
graph.
Position versus time graph:
The slope gives the instantaneous velocity. (vx = lim∆t-->0∆x/∆t
)
Positive slope --> positive velocity
Negative slope --> negative velocity
Constant slope --> constant velocity
Changing slope --> acceleration
(The position versus time graph of motion with constant acceleration is a
section of a parabola.)
Velocity versus time graph:
The slope gives the instantaneous acceleration. (ax = lim∆t-->0∆vx/∆t
)
Positive slope --> positive acceleration
Negative slope --> negative acceleration
Constant slope --> constant acceleration


