Experiment 1
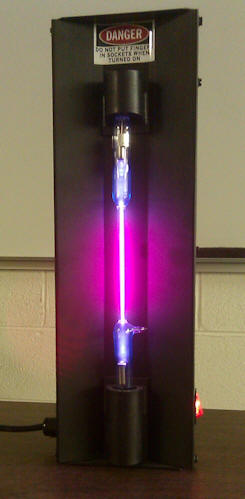
 Plug in and turn on the hydrogen discharge lamp.
Hydrogen gas is excited by a current flowing through the gas. Look
at the light emitted by the excited gas through your spectral glasses.
You will see the line spectrum of hydrogen.

- To measure the wavelengths of the spectral lines, connect the "Red Tide" spectrometer to a USB port of your computer.
- Open the Capstone program.
- Click Hardware Setup, and check that a picture of the "Red Tide" spectrometer is displayed. This tells you that the spectrometer is recognized by the program.
- Close Hardware setup and drag the "Graph" icon onto the page. For the vertical axis choose intensity versus wavelength.
- Bring the fiber close to the lamp.
- Choose Continuous Mode, Fast Monitor Mode.
- Click the Monitor button and the the autoscaling
icon. Move the fiber until you see a nice spectrum.
The horizontal wavelength range will be 350 nm to 1000 nm, but only data from ~400 nm to ~ 700 nm are meaningful, since the spectrometer is limited to the visible region. - When you are satisfied with your spectrum click stop.
- Add a coordinates tool. Drag it to each peak and record its wavelength.
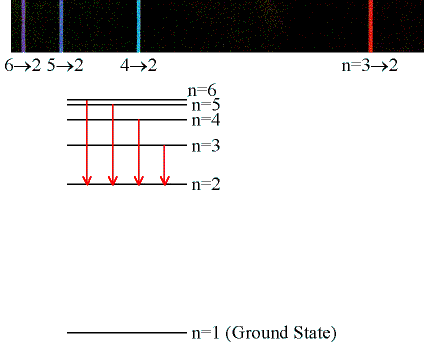
You should see 4 peaks in the visible region with very different intensities. The peaks correspond to the 4 longest wavelength lines of the Balmer series. From ni = 3, 4, 5, and 6 to nf = 2. Determine the wavelength of each peak as accurately as possible. Enter each wavelength in units of nm into a spreadsheet.
| ni | color | λ (nm) | 1/λ (nm-1) | (1/4 - 1/ni2) |
|---|---|---|---|---|
| 6 | v | |||
| 5 | vb | |||
| 4 | bg | |||
| 3 | r |
- Let column D contain 1/λ. Let column E contain (1/4 - 1/ni2). Into cell E2 type =1/4-1/A2^2 and copy the formula into the other cells of the column.
- Plot 1/λ (y-axis) versus (1/4 - 1/ni2) (x-axis). The slope of this graph should be the Rydberg constant R.
- Add a trendline to find the slope. Display the equation on the chart and set the intercept to be zero. Format the trendline label, scientific number format, with 3 decimal places. The slope is your measured Rydberg constant in units of nm-1. Paste your plot into your log.
- Calculate the value for R = 13.6 eV/(hc) with hc = 1240 eV nm and compare your measured value with your calculated value. What is the percent difference?
- Do you understand what you just did? If not, ask questions.