Photons are the particles of light. Matter
is made of atoms, and atoms are made protons, neutrons and electrons.
These are not macroscopic particles. Typical atomic dimensions are on the
order of 10-10 m, nuclear dimensions are on the order of 10-15
m, and the electron seems to be a point particle with no size at all. How do
these particles behave?
If a wave equation describes the behavior of photons, maybe a wave equation also describes the behavior of other
microscopic particles.
In 1924,
Luis
deBroglie (Nobel Prize in Physics in 1929) proposed that a wave function is associated with
all particles. Where this wave function has nonzero amplitude, we are likely to
find the particle. The standard interpretation is
that the intensity of the wave function of a particle at any point is
proportional to the probability of finding the particle at that point.
The wave function for a material particle is often
called a matter wave.
The relationship between momentum and wavelength
for matter waves is given by p = h/λ, and
the relationship energy and frequency is E = hf. The
wavelength λ = h/p is called the
deBroglie wavelength, and the
relations λ = h/p and f = E/h are called the
deBroglie relations.
These are the same relations we have for the photon, but for non-relativistic particles E =
½mv2 = p2/(2m), so E = ћ2k2/(2m),
λ = h/√(2mE).
The relationship between λ and E is different
for particles than for photons.
For photons: E = hf = hc/λ
= pc, so
λ = h/p = hc/E.
For particles: E = ½mv2 =
p2/(2m), so λ = h/p = h/(mv) = h/√(2mE).
A spread in wavelengths means an uncertainty in the momentum. The uncertainty
principle also holds for material particles. The minimum value for the product
∆x ∆p is on
the order of ħ.
∆x ∆p ~ ħ.
For any particle, we cannot predict its position
and momentum with absolute certainty. The product of the uncertainties is on the
order of h/2π = ħ or greater.
Problem:
What is the deBroglie
wavelength of an electron after being accelerated
through a potential difference of 25 kV in a television set?
Solution:
- Reasoning:
The deBroglie
wavelength of an object is defined as λ = h/p.
- Details of the calculation:
λ = h/p, E = p2/(2m), p = √(2mE), λ = h/√(2mE).
The energy of the electron is 25000 eV * 1.6*10-19
J/eV =
4*10-15 J.
λ = (6.626*10-34 Js)/√(2*9.1*10-31
kg*4*10-15
J) = 7.8*10-12 m.
This wavelength is approximately 100 times smaller than the typical size
of an atom.
Problem:
If you double the kinetic energy of a particle, how does the deBroglie
wavelength change?
Solution:
- Reasoning:
λ = h/p, E = p2/(2m), p is proportional to
√E, λ is
proportional to 1/√E.
- Details of the calculation:
λ2/λ1 = √(E1/E2) = 1/√2.
The
deBroglie wavelength decreases by a factor of 1/√2.
λ2 = 0.707 λ1.
Problem:
If you double the speed of a particle, how does it deBroglie wavelength
change?
Solution:
- Reasoning:
λ = h/p, p = mv, p is proportional to v, λ is proportional to 1/v.
- Details of the calculation:
λ2/λ1 = (v1/v2) = ½.
The
deBroglie wavelength decreases by a factor of ½.
λ2 = 0.5 λ1.
Problem:
What is the deBroglie wavelength of a baseball with m = 145 g and speed v =
60 mph = 26.8 m/s?
Solution:
- Reasoning:
The deBroglie wavelength of an object is defined as λ = h/p, p = mv, λ = h/(mv).
- Details of the calculation:
λ = (6.626*10-34 Js)/(0.145 kg *26.8 m/s) = 1.7*10-34
m.
This wavelength is
immeasurably small. For predicting the motion of macroscopic objects,
the deBroglie wavelength and the Heisenberg uncertainty principle are of no
concern.
Think about:
If electron and a proton have the same speed, which has the greater deBroglie
wavelength?
AI Study Tip:
Example prompts:
- I need to practice calculating the deBroglie wavelength of free
particles (like electrons vs. macroscopic objects) for my physics class.
Act as a Socratic physics coach. Do not give me the answers or the
full math upfront. Instead, give me one sample problem at a time.
Guide me through identifying the correct constants (like Planck's constant h
and particle masses) and the algebraic steps. Wait for my response
after each step.
- Help me work through a problem using the Heisenberg uncertainty
principle ∆x ∆p ~ ħ. I want to see how the
uncertainty behaves for a tiny particle like an electron versus a large
object like a baseball. Walk me through setting up the algebra
step-by-step, checking my SI units along the way. Ask me what the next
step should be instead of doing it for me.
Electron Diffraction
 The first experimental
verification of deBroglie
The first experimental
verification of deBroglie
's hypothesis came from two physicists working at Bell
Laboratories in the USA in 1926. They scattered electrons off Nickel
crystals and noticed that the electrons were more likely to appear at certain
angles than others. The work was carried out by Clinton Davisson and
Lester Germer. The Davisson-Germer apparatus is a vacuum glass tube which has
in its interior an accelerator of electrons, a crystal target and an electron
detector. The figure on the right shows a simplified sketch
of the experimental setup. An
electron beam with an adjustable energy is sent to a crystal surface, and
the current of electrons detected at a particular scattering angle theta is
measured. When the electron beam strikes a crystal
target, it is diffracted.
 The Davisson-Germer
experiment showed that constructive interference occurs at scattering angles satisfying
the condition d sinθ = nλ with λ = h/p. The kinetic energy of the electrons
accelerated through a potential difference (voltage) V is E = ½mv2 =
p2/(2m) = qeV and the deBroglie
The Davisson-Germer
experiment showed that constructive interference occurs at scattering angles satisfying
the condition d sinθ = nλ with λ = h/p. The kinetic energy of the electrons
accelerated through a potential difference (voltage) V is E = ½mv2 =
p2/(2m) = qeV and the deBroglie
formula then yields λ = h/(2mqeV)½,
where qe and m are the charge and the mass of the electron respectively.
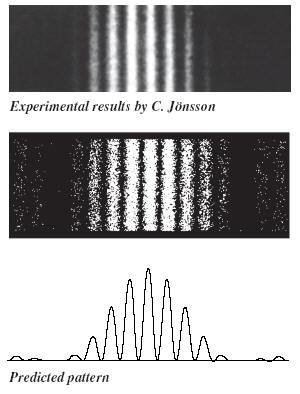 In the early 1960s it was possible
to do an actual two-slit interference experiment with electrons. The experiment
was done by C. H. Joensson who created slits in copper foil about 0.5 micrometer
in width and spaced 1 to 2 micrometer apart. The electrons had a kinetic energy
of 50 keV and the interference pattern was displayed on a screen 35 cm from the
slits. To make the pattern visible Joensson employed a clever scheme of
electrostatic lenses to magnify the image of the interference pattern. The figure on the right shows a
simulation of the experiment and the predicted pattern.
In the early 1960s it was possible
to do an actual two-slit interference experiment with electrons. The experiment
was done by C. H. Joensson who created slits in copper foil about 0.5 micrometer
in width and spaced 1 to 2 micrometer apart. The electrons had a kinetic energy
of 50 keV and the interference pattern was displayed on a screen 35 cm from the
slits. To make the pattern visible Joensson employed a clever scheme of
electrostatic lenses to magnify the image of the interference pattern. The figure on the right shows a
simulation of the experiment and the predicted pattern.
Problem:
What is the angular separation of the interference maxima when 50 keV
electrons pass through two slits spaced 1 micrometer apart?
Solution:
- Reasoning:
The deBroglie wavelength of the electrons is λ = h/p, E = p2/(2m), p = √(2mE), λ = h/√(2mE).
- Details of the calculation:
The energy of the electron is
50000 eV * 1.6*10-19 J/eV =
8*10-15 J.
λ = (6.626*10-34 Js)/√(2*9.1*10-31
kg*8*10-15
J) = 5.5*10-12 m.
sinθ = λ/d = 5.5*10-6.
θ = 5.5*10-6 rad = 3.15*10-4 deg is the
angular separation of the maxima.
Embedded Question 2
- Why do we not observe matter diffraction in everyday life?
Discuss these questions with your fellow students in the discussion forum!