Electric potentials and fields
In this laboratory you will explore the connection between electric field
lines and equipotential surfaces. Objects with
net electric charge attract or repel each other. If you want to change the
position of a charged object relative other charged objects, you, in general,
have to do (positive or negative) work. But sometimes it is possible to
move a charged object relative to other charged objects along a surface without
doing any work. The potential energy of the charged object does not change
as you move it. If an electric charge can travel along a surface without
the electric field doing any positive or negative work, then the surface is
called an equipotential surface.
Open a Microsoft Word document to keep a log of your experimental procedures
and results. Complete all the tasks (in blue). Answer all questions.
Activity 1
The concept of work
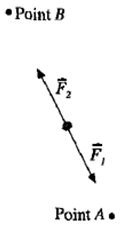 (a) The work W done on an object by a
constant force is defined as W = F∙d. It is equal to the magnitude
of the force, multiplied by the distance the object moves in the direction of
the force.
The SI unit of work is Nm = J.
An object travels from point A to point B while two constant forces of equal
magnitude are exerted on it, as shown in the figure on the right.
- Is the work done on the object by F1 positive,
negative, or zero?
- Is the work done on the object by F2 positive,
negative, or zero?
- Is the net work done on the object positive, negative, or zero?
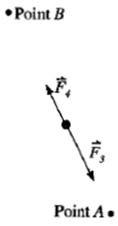 (b) An object travels
from point A to point B while two constant forces of
unequal magnitude are exerted on it, as shown in the figure on the right.
- Is the work done on the object by F3 positive,
negative, or zero?
- Is the work done on the object by F4 positive,
negative, or zero?
- Is the net work done on the object positive, negative, or zero?
Work and the electric field
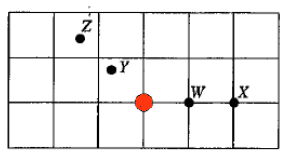 In the diagram on the right, the red dot
denotes a positive point charge. Points W, X, Y, and Z and the point
charge lie in the same plane. Points W and Y are equidistant from the
charge, as are points X and Z.
Draw the electric field vectors at points W, X, Y, and Z.
(c) A particle with charge +qe travels along a straight line from
point W to point X.
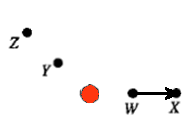
- Is the work done by the electric field on the particle positive,
negative, or zero?
Explain using a sketch that shows the electric force on the particle and the
displacement of the particle.
(d) A particle travels from point X to point Z along the circular arc shown.
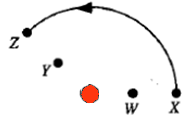
- Is the work done by the electric field on the particle positive,
negative, or zero? Explain!
Hint: Sketch the direction of the force on the particle and the
direction of the displacement for several short intervals during the motion.
Electric potential difference
A potential energy function is a function of the
position of an object. It can only be defined for
conservative forces. A force is
conservative if the work it does on an object depends only on the initial and
final position of the object and not on the path.
(e)
Suppose the moving charge in part (c)
increases from +qe to +1.8 qe.
- Is the work done by the electric field as the particle travels from W to
X greater than, less than, or equal to the work done by the electric field on
the original particle. Explain!
- How is the quantity "the work divided by the charge" affected by this
change?
(f) The electric potential difference ∆VWX between two points W and X
is defined to be the negative of the work done by the electric field on a charge q, divided by q, as q travels from W to X.
- Does this quantity depend on the magnitude of the charge that is used?
Explain!
- Does this quantity depend on the sign of the charge that is used? Explain!
When a net force does work on an object, its
kinetic energy changes.
Wnet = ½m(vf2 - vi2)
= ∆K.
(g) A particle of charge |qe| = 3*10-6 C and mass m = 3*10-8 kg
is released from rest at point W. The speed of the particle is measured to be
30 m/s as it passes point X.
- Is qe positive or negative? Explain!
- What is the change in the kinetic energy of the particle as it travels from
point W to point X?
- Find the work done on the particle by the electric field between points W and
X.
- What is the electric potential difference ∆VWX = VW - VX between
points W and X?
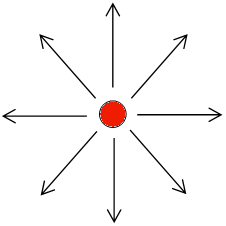
(h) Assume you have a test charge at rest at a distance of
2 cm from the charge on the right. You want to move it.
What path could you choose, so you would not
have to do any work? What is the shape of the equipotential
surface? (Remember that in general you can move in three
dimensions.) Explain your reasoning.
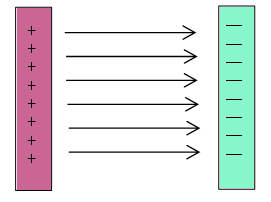 (i)
Find some equipotential surfaces for the charge
configuration shown on the right, which consists of two charged metal
plates placed parallel to each other.
What is the shape of the equipotential surfaces? Remember you are trying to
decide how a test charge could move so that the electric field does no
work on it. Sketch your predictions and explain your reasoning.
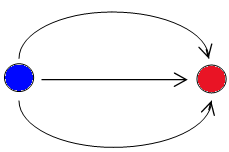 (j) Find some equipotential surfaces for the electric
dipole charge configuration shown on the right.
Sketch your predictions and explain your reasoning.
(k) Review these 3-dimensionl representations of equipotential surfaces and field
lines.
Choose several different configurations.
Do these 3D representations help you visualize the relationship between
electric field lines and equipotential surfaces?
Activity 2
Review these 3-dimensionl representations of equipotential sufaces and field
lines.
(a)
Equipotential surfaces of a charged sphere
(b) Field lines and
equipotential surfaces
Now use a spreadsheet to calculate the electric potential at grid
points in the in the x-y plane due to 1, 2, 3, or 4 small, uniformly-charged
spheres. The x-y plane is divided into a 25 x
25 grid. The upper left corner of the grid corresponds to x = 0.5 m, y =
0.5 m, and the lower right corner corresponds to x = 24.5 m, y = 24.5 m.
The charged spheres can be placed anywhere on the grid. They will be
located in the x-y plane. The spreadsheet calculates the potential at each
grid point and produces a surface and a contour plot of the potential.
The potential at
r = (x,y,z) outside a uniformly
charged sphere centered at r' = (x',y',z') is
V(r)
= kq/|r - r'| = kq/((x - x')2 + (y - y')2 + (z -
z')2)1/2.
In the x-y plane we have z = 0 and
V(x,y) =
kq/((x - x')2 + (y - y')2)1/2.
The constant k has a value of 9*109 in SI
units. If we measure q in units of nC = 10-9C, then kq = 9*q Nm2/C
Download this Microsoft Excel spreadsheet.
Examine the spreadsheet
Cells B1 -Z1 contain the x-coordinates and cells A2 - A26 the
y-coordinates of the grid points
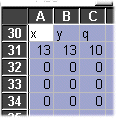
Cells A31 - C34 contain the x- and y-coordinates (in
units of m) of the positions and the magnitudes (in units of nC) of four
charges.
The spreadsheet initializes with a +10 nC charge at x =
13 m, y = 13 m and all the other charges have zero magnitude.
(When
you add more charges, let the x- and y-coordinates always be integers.
This avoids "divide by zero" errors, since the grid points have half
integer x- and y-coordinates.)
Cell B2 contains the formula
=9*$C$31/SQRT((B$1-$A$31)^2+($A2-$B$31)^2)
+9*$C$32/SQRT((B$1-$A$32)^2+($A2-$B$32)^2)
+9*$C$33/SQRT((B$1-$A$33)^2+($A2-$B$33)^2)
+9*$C$34/SQRT((B$1-$A$34)^2+($A2-$B$34)^2)
This is the sum of
V(x,y) = kq/((x - x')2 + (y - y')2)1/2 due to the four charges.
Cell B2 is copied into the other cells of the
grid. The grid consists of cells B2 - Z26.
The spreadsheet shows two plots of the potential at
the grid points. The contour lines are equipotential lines. They are
spaced in 5V intervals.
(a) Start with just the one +10 nC charge at x = 13 m, y = 13 m.
Describe the graphs.
What do they tell you about the potential outside a uniformly charged sphere?
Can you get information about the electric field outside a uniformly charged
sphere from these graphs, i.e. can you draw field lines? Estimate the
magnitude and direction of the electric field in units of V/m = N/C at x = 20 m,
y = 13 m.
(b) Now change the positions and
magnitudes of your charges. Use the numbers below.
| x |
y |
q |
| 5 |
13 |
10 |
| 20 |
13 |
10 |
| 0 |
0 |
0 |
| 0 |
0 |
0 |
Just type in the new numbers into the cells
A31 - C34 and the spreadsheet and the graphs will update automatically.
Paste the upper graph into your word document. Describe
both graphs. What do they tell you about the potential of this charge distribution?
(c) Again change the positions and
magnitudes of your charges. Use the numbers below.
| x |
y |
q |
| 5 |
13 |
10 |
| 20 |
13 |
-10 |
| 0 |
0 |
0 |
| 0 |
0 |
0 |
Paste the upper graph into your word document. Describe
both graphs. What do they tell you about the potential of this charge distribution?
(d) Again change the positions and
magnitudes of your charges. Use the numbers below.
| x |
y |
q |
| 10 |
10 |
5 |
| 20 |
10 |
-10 |
| 10 |
20 |
-10 |
| 20 |
20 |
5 |
Paste the upper graph into your word document. Describe
both graphs. What do they tell you about the potential of this charge distribution?
Convert your log into a lab report.
See the grading scheme for all lab
reports.
Name:
E-mail address:
Laboratory 5 Report
- In one or two sentences, state the goal of this lab.
- Make sure you completed the entire lab and answered all parts. Make
sure you show your work and inserted and properly labeled relevant tables
and plots.
- Add a reflection at the end of your report in a short essay format.
Save your Word document (your name_lab5.docx), go to Canvas, Assignments, Lab
5, and submit your document.
 (a) The work W done on an object by a
constant force is defined as W = F∙d. It is equal to the magnitude
of the force, multiplied by the distance the object moves in the direction of
the force.
 (b) An object travels
from point A to point B while two constant forces of
unequal magnitude are exerted on it, as shown in the figure on the right.
  In the diagram on the right, the red dot
denotes a positive point charge. Points W, X, Y, and Z and the point
charge lie in the same plane. Points W and Y are equidistant from the
charge, as are points X and Z.


 (i)
Find some equipotential surfaces for the charge
configuration shown on the right, which consists of two charged metal
plates placed parallel to each other.
 (j) Find some equipotential surfaces for the electric
dipole charge configuration shown on the right.