Circuit elements
 Our bodies separate and store charge as a power source to transmit signals
along nerves. An excess of positive ions on the outside
of the cell membrane results in a potential difference across the membrane.
The inside of the cell is at a negative potential of ~100 mV with respect to the
outside. The membrane acts like a capacitor.
Our bodies separate and store charge as a power source to transmit signals
along nerves. An excess of positive ions on the outside
of the cell membrane results in a potential difference across the membrane.
The inside of the cell is at a negative potential of ~100 mV with respect to the
outside. The membrane acts like a capacitor.
Electrical signals play a
role in transmitting information through our bodies. Sensory
information is transmitted via nerves. Each nerve consists of a
bundle of nerve cells or neurons. A neuron receives stimuli at the
input end and produces a signal that is transmitted across the axon to
the output end. The axon membrane can be modeled as a charged
capacitor. When the neuron is stimulated, the voltage across the
capacitor rapidly changes and the charge on the plates reverses, only to
thereafter quickly return back to its original value. For this to
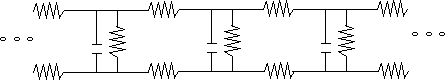
happen, a current must flow through some effective resistance. The
whole axon can be modeled as a chain of capacitors and resistors
connected in series and parallel. A voltage and current pulse
propagates along this chain.
 The speed of propagation of the
action potential depends on the electrical resistance R within the core
of the axon and the capacitance C across the membrane. A simple
electrical circuit, consisting of a resistor in series with a capacitor,
has a time constant τ = RC. The
time constant characterizes the time it takes for the capacitor to
charge and discharge and therefore limits the maximum speed with which
signals can travel through the circuit.
The speed of propagation of the
action potential depends on the electrical resistance R within the core
of the axon and the capacitance C across the membrane. A simple
electrical circuit, consisting of a resistor in series with a capacitor,
has a time constant τ = RC. The
time constant characterizes the time it takes for the capacitor to
charge and discharge and therefore limits the maximum speed with which
signals can travel through the circuit.
In this laboratory you will investigate the behavior
of simple circuits containing resistors and capacitors. While you
will not model neurons directly, you will become more familiar
with how circuits in general behave, and therefore also with how neuron circuits
behave.
Open a Microsoft Word document to keep a live journal of
your experimental procedures and your results. Include all deliverables,
(data, graphs, analysis, outcome). Write a 'mini-reflection' immediately
after finishing each investigation, experiment or activity, while the logic is
fresh in your mind.
The resistance of your body
Fatal electric shock occurs when a sufficiently large electric
current flows through the body. A fraction of such a current flows through the
heart and may disrupt the cardiac cycle. Typical effects are listed in the
table below.
| Shocking current: |
Effect: |
| <1 mA |
no observable effect |
| ~1 mA - ~10 mA |
tingling sensation |
| ~10 mA - ~100 mA |
muscular paralysis
("can't let go") |
| ~100 mA |
ventricular fibrillation |
| ~1A - ~10 A |
thermal damage to tissue |
Paradoxically, brief currents of > 1 A may be less dangerous than lower
currents. Instead of putting the heart into ventricular fibrillation, these currents clamp the whole heart muscle at the same time. When the
current is turned off, a normal heart beat may resume on its own accord.
Indeed, currents of about 1 A are used clinically to defibrillate the heart.
Experiment 1
Before taking any measurements or looking up data, make a prediction. Do
you think your body's electrical resistance will be higher when your skin is
completely dry, or when it is wet with tap water? Write down your
reasoning.
Do you have a digital multimeter? Then use it to measure the resistance of
your body when you hold one lead of the multimeter in one hand and the other
lead in the other hand. (Switch the meter on the 20 MΩ (or closest) scale.
Make sure the leads are plugged into the Ω and COM
connectors of the meter. Press the thumb of one of your
hands against the black and the thumb of the other hand against the red lead.)
If you do not have a multimeter, look at shared data in the forum.
Do the results match your prediction? Why do you think moisture changes
the electrical properties of skin?
Based on the actual measured resistance, calculate what current would flow
through you if you accidentally touched a 110 V wall outlet with a wet or dry
hand while the other hand touches a grounded object. Look at the Fatal
Shock Table. What physiological effect would this have on you?
The salty fluids within the human body are electrical conductors. Salt
water conducts electricity because it has mobile electrons and ionic states via
the salt atoms. Salt water provides a large surface area of contact for
the conductive element and it connects with the sweat glands so electricity can
flow past the skin and into your body, which has low electrical resistance. The internal resistance of an arm (from hand to shoulder) is less than 100 Ω. If there is a voltage across this internal resistance, a current will flow and
heat will be generated. If the current is large or the connection time is long
enough, this heat will cause burns and destroy tissue. Fortunately the
resistance of dry skin is high. The dry protein of your skin is an
insulator. Using a typical contact area, the skin acts
like an approximately (10 - 100) kΩ resistor in series with the internal
resistance of the body. At voltages below about 50 V the dry skin
provides safe current limiting protection.
Be extremely careful not to have electrical contact with a voltage
source if you have wet or sweaty skin.
Experiment 1 Deliverables: (to be included in the your journal)
- Analysis: Your prediction with your reasoning before the
measurement.
- Outcome: Your calculation of the current that would flow
through you if you accidentally touched a 110 V wall outlet with a wet or
dry hand.
DC circuits
Activity 1
Link to the simulation:
https://phet.colorado.edu/en/simulations/circuit-construction-kit-dc
Click the Lab icon. Explore the interface!
- Components are dragged from the toolbox to make circuits.
- To explore the properties of a component, tap it. You can then
change many properties and also remove the component.
 (a) Use one ideal battery (30V, 0 Ω internal
resistance), a light bulb (20 Ω) resistance) and ideal wires (near 0
Ω resistance) to build the circuit shown on the right. Make sure your
light bulb lights up. Use the voltmeter to measure the potential difference (ΔV)
across the battery. Record only the magnitude of the potential
difference (omit +/- signs). Make a similar potential difference
measurement across the bulb and across each length of wire. With
the non-contact ammeter, measure the current through the bulb, IBulb.
(a) Use one ideal battery (30V, 0 Ω internal
resistance), a light bulb (20 Ω) resistance) and ideal wires (near 0
Ω resistance) to build the circuit shown on the right. Make sure your
light bulb lights up. Use the voltmeter to measure the potential difference (ΔV)
across the battery. Record only the magnitude of the potential
difference (omit +/- signs). Make a similar potential difference
measurement across the bulb and across each length of wire. With
the non-contact ammeter, measure the current through the bulb, IBulb.
What to do if you have problems with the
animation speed!
Fill in "Table A" below..
| ΔVBattery |
ΔVwire A |
ΔVwire B |
ΔVBulb |
IBulb |
| |
|
|
|
|
(b) The Brightness Challenge
(i) You are given two 30 V ideal batteries and three 20 Ω light bulbs.
Your mission is to design a circuit that makes the bulbs glow as brightly as
possible. Experiment in the simulation. Take a screenshot your
winning circuit. Design your own data table to record the voltage and
current for each component. Explain why this specific configuration
(series, parallel, or a mix) maximizes the power delivered to the bulbs using
Ohm's Law.
(ii) Now design a circuit that makes all bulbs glow but produces the least
amount of light. Take a screenshot your winning circuit. Design your
own data table to record the voltage and current for each component.
Explain why this specific configuration (series, parallel, or a mix) minimizes
the power delivered to the bulbs using Ohm's Law.
(c) The Internal Resistance Puzzle
In the simulation, when the bulbs glow as brightly as possible, change the
battery's internal resistance to 2 Ω. Don't fill out a table, just look at
the bulbs. What physically changed? Why does a battery heating up
internally affect the brightness of the bulbs down the line?
Activity 1 Deliverables: (to be included in the your journal)
-
Visuals: Your screenshots for part (b).
- Analysis: Your explanations for parts (a) - (c).
- Outcome: Your data tables for parts (a) and (b).
Ohmic and non-ohmic circuit elements
Activity 2
- Watch
this Youtube video clip discussing resistors.
As far as a circuit is concerned, any device that converts
electrical energy into thermal energy is a resistor. But most devices have
a more descriptive name, such as hair dryer or heating element, etc.
There are devices that are referred to as resistors, primary purpose is the
limit the current flowing in a circuit.
- Watch this
Youtube
video clip discussing the resistance of a light bulb.
If a 9 V battery causes the same current to flow through a resistor and a
light bulb, both devices dissipate the same power. But the temperature
of the resistor barely changes, while the light bulb gets very hot.
The resistor has a large surface area and dissipate heat efficiently by
conduction and convection in air. The light bulb filament has a small
surface area and is in near vacuum. It mainly dissipates heat by
radiation. That only becomes efficient at high temperature, because
the radiated power is proportional to thr temperature to th 4th power. (Stefan-Boltzmann
Law).
- Watch this
Youtube
video clip discussing diodes and LEDs.
Diodes and LEDs ar semiconductor devices with conduction characteristics that
can be understood using quantum mechanics but not classical theory.
In a few sentences explain how you can perform and experiment to find out if
a circuit element is ohmic or nonohmic. What measurements do you make and
how do you decide, based on the results of your measurements.
Activity 2 Deliverables: (to be included in the your journal)
- Analysis:
In a few sentences explain how you can perform and experiment to find out if
a circuit element is ohmic or nonohmic. What measurements do you make and
how do you decide, based on the results of your measurements.
RC circuits
Activity 3
Link to the simulation:
https://phet.colorado.edu/en/simulations/circuit-construction-kit-ac
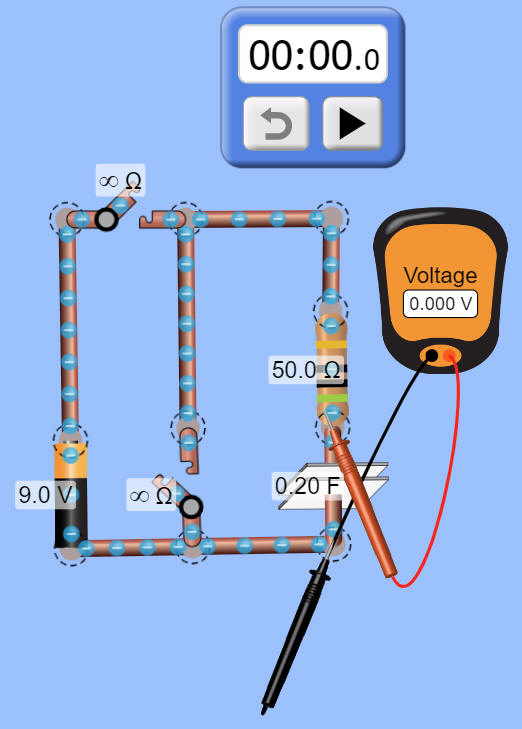
Click the Lab icon. Construct a circuit as shown in the diagram below.
Choose R = 50 Ω, C = 0.2 F, V = 9 V.
Use the voltmeter to measure the voltage across the capacitor.
An example is shown below.
(a) Look at the RC circuit before closing the switch.
At the exact millisecond the switch is closed (t = 0), do you think the
capacitor acts like an open switch (infinite resistance, blocking current) or a
straight wire (zero resistance, letting current flow freely)? Make a
hypothesis.
(b) Charging the capacitor:
With the simulation paused, start by clicking on the capacitor to discharge
it. The initial voltage across the capacitor should be 0 V.
Click the start button on the stopwatch. The stopwatch will start when you
play the simulation. Close switch S1.
You will monitor the voltage across the capacitor as a function of time as
the capacitor in the
RC circuit is
charging. Start the simulation, then pause it at roughly 0.5 V
intervals between 1 V and 8.9 V and record the voltage and time in a table in
this
spreadsheet.
- Paste a screenshot of your circuit into your word document.
- Construct a plot of Vc versus t and paste it into your word
document. (Make sure you do not switch the axes.)
We expect VC = V0(1 - e-t/τ), where V0
= 9 V is the battery voltage. We
can rewrite this as 1 - VC/V0 = e-t/τ,
or ln(1 - VC/V0) = -t/τ.
If we plot ln(1 - VC/V0) versus time the slope will be -1/τ,
where τ is the time constant of the RC circuit.
- Add a ln(1 - VC/V0) column to your
spreadsheet. (The first row with the formula is already filled in.)
- Plot ln(1 - VC/VO) versus time.
- Add a linear trendline, with the intercept set to zero and display the
equation on the chart.
- What is your measured time constant of the RC circuit?
- How does this compare to the expected time constant τ = RC?
- How long does it take to charge the capacitor to VC = 4.5 V?
Activity 3 Deliverables: (to be included in the your journal)
-
Visuals: Your plot of ln(1 - VC/VO)
versus time (with trendline).
- Analysis:
- While collecting your voltage data over time, notice how the numbers
change more slowly as time moves on. Why does a capacitor charge
quickly at first, but takes a much longer time to reach those final few
fractions V0? What is happening to the repelling
charges on the plates?
- You plotted ln(1 - VC/V0) and found the slope.
Instead of just matching it to τ = RC, explain what the time constant τ
actually means to a human. If a pacemaker or a turn signal circuit has
a large time constant versus a small time constant, how does that change its
real-world behavior?"
Convert your journal into a lab report.
Name:
E-mail address:
Laboratory 3 Report
- Make sure you completed the entire lab and answered all parts. Make
sure you show your work and inserted and properly labeled relevant tables
and plots in your journal.
- Add a summary reflection at the end of your report in a short essay format.
Save your Word document (your name_lab3.docx), go to Canvas, Assignments, Lab
3, and submit your document.