Lab 10
The photoelectric effect
In the last lab you observed diffraction and interference. You studied the diffraction and interference patters produced by single and multiple slits and verified that one can predict the positions of the maxima and minima in these patterns by assuming that light is an EM wave. Where crests meet crests and troughs meet troughs we predict and observe maxima or bright regions, and where crests meet troughs we predict and observe minima or dark regions.
So light is a wave, these experiments settle this? Not so fast!
In this lab you will simulate an experiment that suggests that light is
a particle. You will investigate the photoelectric effect. To eject an electron from a metal
surface a certain amount of energy Φ must be supplied to this electron. Φ
is called the work function of the metal. (If no energy
were required to free the electrons, they would just leave ordinary pieces of
metal.)
In the wave picture the energy of the light beam does not depend
on the frequency, but only on the intensity, which is proportional to the square
of the amplitude. Einstein explained the photoelectric effect by
postulating that an electron can only receive the large amount of energy
necessary to escape the metal from the EM wave by absorbing a single photon. If this photon has enough energy,
the electron is freed. Excess energy appears as kinetic energy of the
electron. The maximum kinetic energy of the electron is given by E = hf -
Φ. If the photon does not have enough energy, then the electron cannot
escape the metal.
In this lab you will direct light with different wavelength onto a metal surface and measure the kinetic energy of the photoelectrons ejected from the metal as a function of the frequency of the light used to eject the electrons. You will measure the work function of the metal and also determine the value of Planck's constant from your data. This experiment reveals the "particle nature" of light. A second experiment in the studio session will reveal the "wave nature" of electrons. You will observe and analyze electron diffraction.
Open a Microsoft Word document to keep a live journal of your experimental procedures and your results. Include all deliverables, (data, graphs, analysis, outcome). Write a 'mini-reflection' immediately after finishing each investigation, experiment or activity, while the logic is fresh in your mind.
Experiment 1
Imagine light behaves strictly as a classical wave (similarly to a water wave delivering energy continuously). If you turn up the intensity (brightness) of a light source, what should happen to the maximum kinetic energy of the ejected electrons? What should happen if you change the wavelength? Write down your predictions.
Now use an on-line simulation
from the University of Colorado PhET group.
Link to the simulation:
http://phet.colorado.edu/en/simulations/photoelectric
Explore the interface. There are some non-obvious controls.
- You can select Show photons in the Options menu to show the light beam as composed of individual photons.
- You can select Control photon number instead of intensity in the Options menu to change the Intensity slider to a Number of photons slider.
- You can use the camera icon to take a snapshot of the graphs so that you can compare graphs for different settings.
- You can Pause the simulation and then use Step to incrementally analyze.
In the simulation photons strike a metal cathode and eject
electrons. Electrons are ejected with a range of energies, up to a maximum
energy. The electrons are collected on the anode and then flow back from
the anode to the cathode through a wire. The current in the wire is
measured. Electrons
are negatively charged. If the anode is at a positive voltage compared to
the cathode, electrons are attracted and gain energy. If the anode is at a
negative voltage compared to the cathode, electrons are repelled and loose
energy. Let Vca = Vcathode - Vanode.
If this potential difference Vca (energy per charge) becomes large
enough, electrons will no longer reach the anode and current will no longer flow
in the wire.
It is convenient to measure electron energy in units of electron volt (eV). In SI units 1 eV = 1.6*10-19 J.
If the potential difference between
the cathode and anode is x volts (Vca = x V), then electrons ejected from the
cathode need an energy of at least x eV to overcome this potential difference
and to reach the anode. By determining voltage Vca needed to reduce the
current in the wire to zero, we can determine the maximum energy
of the ejected electrons.
The maximum energy E of electrons that reach the anode in eV has the same
numerical value as the voltage in Vca.
(a) Exploration using a Sodium target:
- For a fixed number of photons and zero battery voltage, how does the number of photoelectrons ejected depend on the wavelength? Does every photon eject an electron? Does the probability of ejection change with wavelength?
- For a fixed wavelength and zero battery voltage, how does the current depend on the light intensity?
- For a fixed wavelength and light intensity, how does the current depend on the battery voltage?
- For a fixed wavelength and light intensity, do all ejected electrons have the same energy? How can you measure the maximum energy of the ejected electrons.
(b) Measurement:
Your goal is to experimentally determine two values using a Sodium target, Planck�s constant h and the work function Φ of Sodium. Set the light intensity to 100%.
Look at your exploration data. What mathematical relationship seems to exist between the frequency or wavelength of light and the maximum kinetic energy of the electrons? (Is it linear, or quadratic, or inverse, etc?) Design a data collection strategy. How many different wavelengths should you test to confidently map this relationship? Fill out your own data table based on your plan. Create a graph that allows you to extract h and Φ.
Hint: Think about the equation of a straight line (y = mx + b). What should you plot on the y-axis and x-axis so that the slope and the intercept give you the constants you are looking for?
Note: The text box under the battery displays -Vca.
| Wavelength (nm) | Frequency (s-1) | Maximum Electron Energy (eV) |
|---|---|---|
Since the electron energy is measured in eV and the frequency in 1/seconds, Planck's constant h will have units of eV s and the work function will have units of eV. Convert Planck's constant to SI units (J s) by multiplying the value you obtained from the slope by 1.6*10-19J/eV.
Experiment 1 Deliverables: (to be included in the your journal)
- Visuals: Your data table and your graph with trendline.
- Analysis:
Write a short paragraph defending the quantum model of light over the wave model based strictly on your exploration data and your experiment. Structure your argument as follows:
Claim: State clearly which model of light is supported by your data.
Evidence: Reference specific data points or behaviors from your PhET simulation (e.g., what happened at 100% intensity for red light versus low intensity for UV light?).
Reasoning: Connect your evidence to the theory. Explain why the classical wave model fails to explain your specific evidence, and how Einstein�s photon model perfectly accounts for it. - Outcome:
The value you obtained for h in units of eV s and J s.
The value you obtained for the work function of Sodium in eV.
Experiment 2
How does matter behave on a scale of a few nanometers or smaller? Is its behavior governed by Newton's laws or by a wave equation? The deBroglie relations associate a wavelength λ = h/p = h/√(2mE) with each particle of momentum p. For an electron which has been accelerated through a potential difference of 5 kV and therefore has a kinetic energy of 5000 eV = 8*10-16 J, this wavelength is λ = 1.74*10-11 m. Can we measure λ?
If a beam of accelerated electrons passes through a thin crystal, the crystal planes can act like a diffraction grating. Different crystal planes can produce different diffraction patterns. Planes that are spaced farther apart produce a narrower patterns. You will observe the diffraction pattern produced when 5 keV electrons pass through graphite.
For light normally incident on a grating with slit spacings d, we find diffraction maxima at angles θ away from the normal such that dsinθ = mλ. If we observe the diffraction pattern on a screen a distance L away from the grating, then we can write dz/(mL) = λ if θ is a small angle. For electron diffraction from crystal planes at small angles away from the forward direction, we can use the same formula dz/(mL) = λ to find the diffraction maxima.
Graphite has the crystal structure shown below.
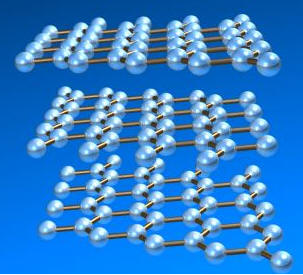
In this orientation, the d100 planes produce a horizontal pattern.
d100 = 2.10*10-10 m
 .
.
In this orientation, the d110 planes produce a horizontal pattern.
d110 = 1.21*10-10
m.
The graphite in our apparatus is not a single crystal, but a polycrystalline powder. The orientation of the various crystals is random. Powder diffraction produces a pattern of concentric rings. The powder diffraction patters is just the superposition of the patterns produced by the individual crystals with random orientations.
Assume for a single crystal with a fixed orientation we observe the pattern below. The diffraction pattern is rotated by the same angle as the crystal.
Then for 4 crystals with 4 different orientations, we also observe 4 different orientations of the diffraction patterns. The individual diffraction patterns plotted in the same color as the corresponding crystal start to add up to rings.
For 40 randomly oriented crystals, powder rings become clearly visible.
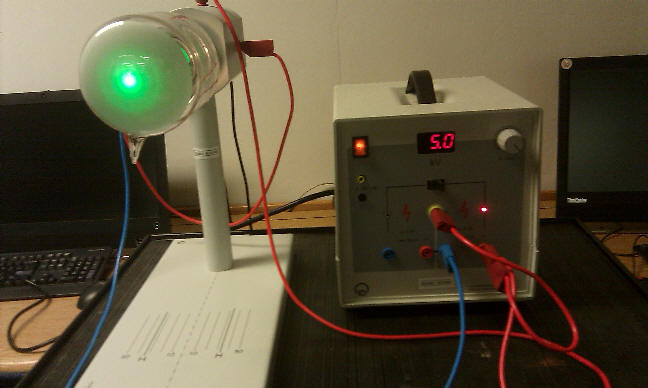 In our experiment accelerated electron with 5 keV
kinetic energy pass through a graphite target in an evacuated tube and
hit a fluorescent screen. We observe the ring pattern on this
screen.
In our experiment accelerated electron with 5 keV
kinetic energy pass through a graphite target in an evacuated tube and
hit a fluorescent screen. We observe the ring pattern on this
screen.
Two rings are clearly visible. These correspond to the
first-order maxima produced by the d100 and the d110 planes. All
other rings are too dim or at angles too small or too large to observe with our
apparatus.
You will measure the diameter of
the two visible rings and calculate the angles θ, given the distance L =
13.5 cm from the target to the screen.
Using the known plane spacings d100 = 2.10*10-10 m
and d110 = 1.21*10-10
m you will then use
dz/L = λ
to experimentally determine the deBroglie wavelength λ of the 5 keV electrons.
Schematic sketch off the apparatus:
L = 13.5 cm (distance between graphite foil and screen)
D = diameter of a diffraction ring observed on the screen
z = D/2
Make the measurements and fill in the table below. Measure the center-to-center distance for each bright ring. The scale on the picture is a mm scale.
| 1st ring (d100) | 2nd ring (d110) | |
|---|---|---|
| d (m) | 2.10E-10 | 1.21E-10 |
| L (m) | 0.135 | 0.135 |
| D (m) | ||
| z | ||
| λ = dz/L |
Experiment 2 Deliverables: (to be included in the your journal)
- Visuals: Your data table.
- Analysis:
Do the two values for λ agree within experimental uncertainty? - What do you think contributes most to the experimental uncertainty?
- Is your experimental value of λ close to the expected deBroglie wavelength of the electrons?
- Does this experiment convince you that electrons do not behave like classical particles, or can you think of a classical explanation for your results?
- If we increased the voltage supplying energy E to the electrons, what would happen to their wavelength? Would it increase or decrease? What should happen to the diameter D of the rings on the screen? Will the rings shrink or expand?
- Outcome:
Your measured deBroglie wavelength λ of the 5 keV electrons.
Convert your journal into a lab report.
Name:
E-mail address:
Laboratory 10 Report
- Make sure you completed the entire lab and answered all parts. Make sure you show your work and inserted and properly labeled relevant tables and plots in your journal.
- Add a summary reflection at the end of your report in a short essay format.
Save your Word document (your name_lab10.docx), go to Canvas, Assignments, Lab 10 and submit your document.