Laboratory exercises are not just about
getting the right result, but about recognizing that fundamental physics
principles shape our everyday experiences and underlie many of the devices that
we use in our personal and professional lives. Please do not treat the
laboratories as cookbook exercises. Permit yourself to think! Thoughtful answers to the questions
in blue will give you most of the laboratory credit.
Open a Microsoft Word document to keep a log of your
experimental procedures and your results. This log will form the basis of
your lab report. Address the points highlighted in blue.
Open a Microsoft Word document to keep a log of your
experimental procedures and your results. This log will form the basis of
your lab report. Address the points highlighted in blue.
Grading scheme for all labs:
-
25% for completion
In order to receive full
credit, you have to complete the entire lab and answer all parts.
Use full sentences explaining your results, show work, insert and properly label tables
and plots, proofread, and use correct units. Make comments if you are
stuck or if your results seem to have errors. Mention what could have
caused these errors in your results and how the results could be improved.
The reports are to help you, so use them like a journal to help
you think about the material.
-
25% for accuracy
You do have to put effort into
these labs. This is a 4 credit-hour course with lab, so, just like for
in-person labs, you have to set aside time to work on the labs.
-
50% for a reflection at the end of your report, i.e. a
personal account of your experience with the lab. It should be written
in the first person. You can format it as a report to a friend or
acquaintance.
You should reflect on the material and mention how well you understood
it.
Did you understand what you were doing during an exercise or activity, or did
you just follow instructions?
Do your results make sense to you, or do you expect them to be wrong? Why?
Do you have suggestions on how to improve the exercise or activities so students
can learn more from them?
...
Some of the phrases you may want to use are:
-
The most important thing was...
-
I learned that...
-
At the time I felt...
-
This was likely due to...
-
After thinking about it...
-
Later I realized...
-
This was because...
-
This was like...
-
I wonder what would happen if...
-
I'm still unsure about...
-
...
Charges and fields
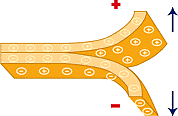 Static electricity is a well-known phenomenon. It affects many industries in diverse
environments. Static charge buildup can result in potentially dangerous electrical shocks,
which can cause fires, explosions and severe damage to sensitive electronic components.
Static charge buildup can be caused by friction between two surfaces. This is called
triboelectrification. Electrons migrate from the surface of one material to the surface of
the other. Upon separation of the two surfaces, one surface loses electrons and becomes
positively charged. The other surface gains electrons and becomes negatively charged.
 As the pressure and the speed of contact separation increase, the amount of static charge buildup increases.
When materials move rapidly past each other, potential of more than 25,000 volts
can develop.
In this laboratory you will separate electric charges. You will consult the triboelectric sequence to find out which object acquires a positive, and which
object acquires a negative charge. You will also investigate the interaction between
the charged objects.
Equipment needed:
- Sticky tape
- Rods and rags
- Styrofoam pieces
Vector fields
If a vector can be assigned to each point in a subset of space, we have a
vector field. One way to graphically represent a vector field in two dimensions is by
drawing arrows an a grid. Set up a grid and find the magnitude and
direction of the field vector at every grid point. At each grid point draw
an arrow with the tail anchored at the grid point and a length proportional to
the magnitude of the vector in the direction of the field vector.
Most vector fields are three-dimensional. But if the field has enough
symmetry, a two dimensional representation can capture most of the
information.
Electric field of a positive point
charge at the origin
The electric field exists in 3-dimensional space. For the arrow
representation we choose a plane containing the single point charge. and
put the point charge at the origin. The field has rotational
symmetry about the origin.
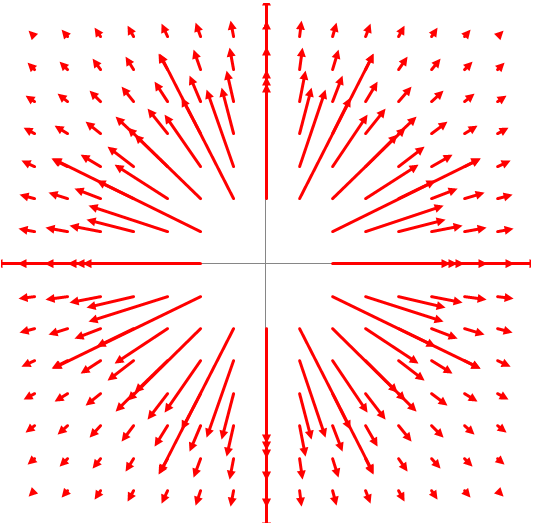
Note how fast the field strength decreases as a function of the distance
from the point charge as a consequence of the 1/r2
dependence.
Arrows near the origin are not drawn, because they are too long.
The magnitude of the field approaches infinity as we approach
the origin.
Exercise 1:
Draw arrows to represent
the electric field.
Please click on the image below!
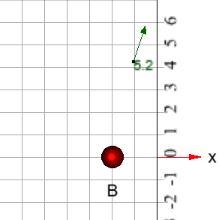
Charge A can be positive or negative and Charge B can be
zero, positive or negative. Both charges can be placed at different
positions on the x-axis.
To produce and arrow pointing in the direction of the electric field with a
length proportional to the electric field strength at some position, click the
position.
The units of charge are 10 nC, the units of distance are m and the
units of field strength are N/C.
- Place a positive charge A at x = -3, y = 0.
- Produce arrows at various positions. What can be said about the magnitude of the electric field at points near the
charge and far from the charge? What is the direction of the electric
field?
What is the electric field strength in N/C and the direction of the electric
field at x = -1, y = 0 and at x = 1, y = 0?
(Paste a picture of your screen into your word document.)
-
Place a second positive charge B at position x = 5, y = 0.
- What happens to the electric field vector at various
positions upon introducing charge B? What is the electric field strength
in N/C and the direction of the electric field at x = 0, y = 0 and at x = 2, y =
0 and at x = 1, y = 2? Can you explain their magnitude and direction
of the electric field at those positions using vector addition of the
field vectors of the two individual charges? (Paste a picture of your
screen into your word document.)
- Change the sign of charge B, i.e. replace the positive with
a negative charge. Repeat!
The arrow representation for the electric field produced by more than one
source can become quite messy, even in two dimensions. Since the field
strength can change very rapidly and the length of an arrow is proportional to
the field strength, many arrows of different length must be drawn, and the
arrows start overlapping.
One way around this is to only draw direction indicators (unit vectors).
You then loose the information about the field strength. Another way to graphically represent a
electric field is by
drawing field lines. If the
rules
for drawing field lines are followed, then the direction of the
field at any point is given by the direction of a line tangent to the
field line, while the magnitude of the field is given qualitatively by
the density of field lines.
Any vector field can be represented by field lines. In general, field
lines can emerge from sources and end in sinks, or they can form closed loops.
To draw a field line calculate the field at a point.
Draw a short line
segment (Δl --> 0) in the direction of the field.
Recalculate the field at
the end of the line segment.
Repeat. (A computer program can do
this efficiently.)
Examples:
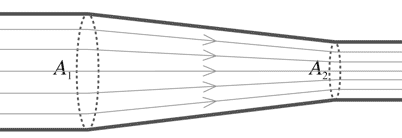 Velocity field lines or
streamlines for a liquid
flowing in a pipe.
The density is higher in region 2 where the velocity of the liquid has a greater magnitude.

Field lines of the gravitational field
near the surface of Earth. The lines are evenly spaced since
the field is constant.
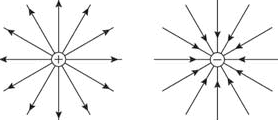
Electric field lines for a positive (source) and for a negative charge
(sink).
The
number of lines emerging from or converging
at the charge is proportional to the magnitude of the charge.
Exercise 2: Drawing field lines to represent
a field
Download a copy of
this word document containing diagrams of
several charge configurations. Paste the diagrams into your word
document.
Draw field lines on the diagrams.
(In Word, click Review, Start Inking to draw with the mouse or a pen, or click
Insert, Shapes and then click the Scribble icon to draw with the mouse.)
Field lines should leave or enter a charge symmetrically, and the number of
lines entering or leaving should be proportional to the magnitude of the charge.
Answer the following questions.
-
If there is no field line drawn at a particular
point, does this mean there is no field at that point? Explain!
-
As you approach a field line, does the field get
stronger? Explain!
-
Is it possible for two field lines to cross each
other? Explain!
Experiment
Obtain a piece of sticky tape, about 15 - 20 cm in length. For ease in handling, make
"handles" by folding each end of tape to form portions that are not sticky.
Press the tape firmly onto a smooth, unpainted surface, for example, onto a textbook
or onto the table.
Then quickly peel the tape off the surface and hang it from a support.
Describe the behavior of the tape as you bring objects, such
as a finger or a pen, towards it.
Make another piece of tape as described above. Bring the second tape toward the
first tape with the non-sticky sides facing each other.
Describe your observations.
It is important,
that during this experiment you keep your hands and other objects away from the tapes.
Explain why this precaution is necessary.
Describe how the distance between the tapes affects the
interaction between them?
Press two pieces of tape onto the surface and write a B (for bottom) on them.
Then press another tape on top of each B tape and label it T (for top).
Pull each
pair of tapes off the surface as a unit. After they are off the surface, separate the T
and B tapes. Hang one of the T tapes and one of the B tapes from a support.
Describe the interaction between the following pairs of tape
when they are brought near one another.
- Two T tapes
- Two B tapes
- One T and one B tape
Our electrostatic materials kits contain rods and rags made from different
materials. Consult the table of triboelectric materials below.
The items on top are less attractive to electrons and become positively charged
when rubbed against items below, while
the items on the bottom are more attractive to electrons and become negatively charged
when rubbed against items above.
- Human Skin (usually too moist though) (very positive)
- Rabbit Fur
- Glass
- Human Hair
- Nylon
- Wool
- Fur
- Lead
- Silk
- Aluminum
- Paper
- Cotton
- Steel (neutral)
- Wood
- Lucite
- Amber
- Hard Rubber
- Nickel, Copper
- Brass, Silver
- Gold, Platinum
- Polyester
- Styrene (Styrofoam)
- Saran Wrap
- Polyurethane
- Polyethylene (like scotch tape)
- Polypropylene
- Vinyl (PVC)
- Silicon
- Teflon (very negative)
Choose a rod and a rag, for example a PVC rod and wool rag or a Lucite rod
and a vinyl rag. Rub the rod vigorously with the rag
and then hold the rod near newly-made T and B tapes hanging from a
support. Compare the interactions of the rod with the tapes to the previously observed
interactions between the tapes.
Describe any
similarities or differences.
The rod and the tapes interact, because they are electrically charged.
Answer the following questions based on the
observations you have made thus far.
- How many different types of charge do there appear to be? Explain.
- Which tape, T or B, has a positive charge? Explain how you come to
this conclusion.
Now remove all tape from the support. Attach a small piece of Styrofoam to
approximately 30 cm of insulating string and hang it from a support.
Touch the Styrofoam piece to a charged rod and observe the behavior of the piece after it touches
the rod.
Is the piece charged? If so, does the piece have net charge with the same sign
the rod? Explain how you can tell.
Exercise 3:
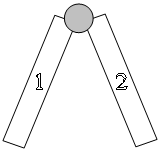
The figure below shows two tapes.
What kind of charge could be on tape 1 and tape 2?
Explain!
Review polarization.
Imagine the following situation.
Two metal balls are touching each other. A charged rod is brought near the left
one. While the rod is near, the right ball is taken away. Finally the rod is
taken away. At the end of this procedure, the left-hand metal ball has a
negative charge.

Describe what you think is happening.
Why is the left ball negatively charged at
the end of the procedure? Explain!
Convert your log into a lab report.
See the grading scheme for all lab
reports.
Name:
E-mail address:
Laboratory 1 Report
- In one or two sentences, state the goal of this lab.
- Make sure you completed the entire lab and answered all parts. Make
sure you show your work and inserted and properly labeled relevant tables
and plots.
- Add a reflection at the end of your report in a short essay format.
Save your Word document (your name_lab1.docx), go to Canvas, Assignments, Lab
1, and submit your document.
 Static electricity is a well-known phenomenon. It affects many industries in diverse
environments. Static charge buildup can result in potentially dangerous electrical shocks,
which can cause fires, explosions and severe damage to sensitive electronic components.
Static charge buildup can be caused by friction between two surfaces. This is called
triboelectrification. Electrons migrate from the surface of one material to the surface of
the other. Upon separation of the two surfaces, one surface loses electrons and becomes
positively charged. The other surface gains electrons and becomes negatively charged.
 As the pressure and the speed of contact separation increase, the amount of static charge buildup increases.
When materials move rapidly past each other, potential of more than 25,000 volts
can develop.

 Velocity field lines or
streamlines for a liquid
flowing in a pipe.


