 Collecting your data
In this laboratory you will explore the connection between electric field lines and equipotential surfaces, and you will use a PASCO EKG sensor to measure the action potential of your heart. Objects with net electric charge attract or repel each other. If you want to change the position of a charged object relative other charged objects, you, in general, have to do (positive or negative) work. But sometimes it is possible to move a charged object relative to other charged objects along a surface without doing any work. The potential energy of the charged object does not change as you move it. If an electric charge can travel along a surface without the electric field doing any positive or negative work, then the surface is called an equipotential surface.
Equipment needed:
Open a Microsoft Word document to keep a log of your experimental procedures and your results. This log will form the basis of your lab report. Address the points highlighted in blue. Answer all questions.
Experiment:
You will use the PASCO EKG sensor to measure the action potential of your
heart.
What does the EKG measure?
Caution: The sensor used in this laboratory will give you a good
view of the electrical activity of the heart, but it is not an instrument to be
used for medical diagnosis. The interpretation of electrocardiograms for
diagnosis requires significant training and experience, something that many of
you can look forward to acquiring in the near future.
Collecting your data
Pick one person to be the subject in your group. If you have time, you
can repeat the experiment with another person as the subject.
Use the
following guidelines to make the EKG measurement.
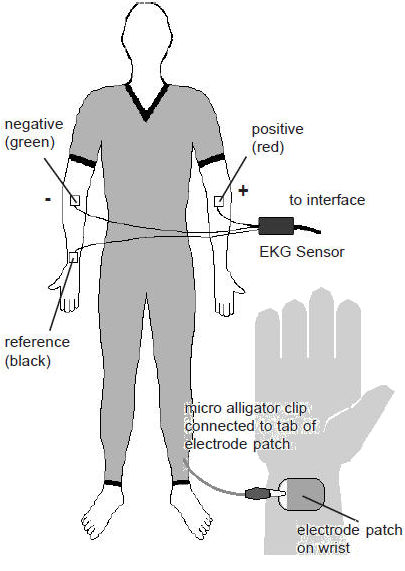
Obtain a paper towel and a little rubbing alcohol. With the dampened paper towel wipe off an area inside each elbow and inside of the right wrist.
Obtain three electrode patches from your instructor. The patches have been designed to reduce the resistance of your skin.
Firmly place the electrode patches onto your skin - one on your
right wrist, one on the inside of the right elbow, and one on the
inside left elbow (as pictured). Leave them in place until you
have completed all EKG activities.
Caution: A very small fraction of students may be
allergic to the electrodes. If you feel a burning sensation or
are extremely uncomfortable, then remove the electrodes immediately
and rinse the area.
Make sure the Pasco 850 interface is turned on. Open the Capstone program. The icon for this program is on the desktop.
Drag a Graph icon onto the main display. For the vertical axis choose Amplitude (mV). Set the sample rate to 250 Hz.
Connect the EKG sensor to the electrodes. The reference (black) lead should be connected to your wrist. This lead will be the "flat line" potential on your EKG. The positive (red) lead should be connected to the electrode on your left elbow. Finally the negative (green) lead should be connected to the electrode on your right elbow. Try to adjust the wires so that they are not twisting or pulling on the electrodes.
Once you are safely and securely connected to the EKG sensor, remain fairly still and breathe normally. A lab partner should operate the computer and start collecting the data.
Start collecting data. Collect enough data for about 5-10
heartbeats.
Save the file with your data for further analysis and
paste the graph into your log.
Disconnect the EKG sensor from the electrodes, but leave the electrodes attached to your arms.
 Analyzing your data
Using your data, answer the following questions for your heart.
Explain how you arrive at your answers. You must justify all
answers.
(a) Peak-to-peak value of the voltage between
the R wave and the S wave.
(b) The P-R time interval.
(c) The Q-R-S time interval.
(d) The Q-T time interval.
(e) The frequency of your heart during data collection (in beats/min and
in Hz)?
Guess what would happen if you switched the red
and green leads? Try it out experimentally and make a sketch of
your results in your logbook. Explain any differences that may
occur due to this change.
EKG after mild exercise
Have your subject stand up and exercise for three minutes (jog in
place, "step in time", walk up and down the stair case, walk briskly
around the hallway, ...). After the three minutes are up,
have the person sit back down and get reconnected to the EKG sensor as
quickly as possible. Collect a new set of data. Save the
file with the data for further analysis and paste
the graph into your log.
Using your data, answer the following questions
for your heart. Explain how arrive at your answers. You must justify all answers.
(a) Peak-to-peak value of the voltage between
the R wave and the S wave.
(b) The P-R time interval.
(c) The Q-R-S time interval.
(d) The Q-T time interval.
(e) The frequency of your heart during data collection (in beats/min and
in Hz)?
Briefly describe the exercise that was
completed. What effect did the exercise have on your EKG?
What things seemed unaffected?
If you have time for some extra lab credit:
 Measure the electrical potential of a Bicep Muscle
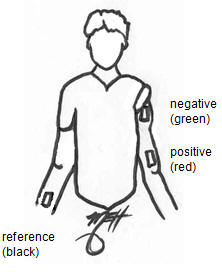
Connect the positive and negative electrode to your subject's upper biceps as shown on the right.
Use a damp paper towel to wipe off the area at the top and at the bottom of the bicep muscle on the arm without an electrode on the wrist.
Firmly place electrodes on your skin so that you have 1 on your right wrist, 1 on the upper portion of the left bicep, and 1 on the lower portion of the left bicep (as pictured).
Connect the sensor to the electrodes. The reference (black) lead should be connected to your wrist. The red and green leads should be connected to the bicep muscle area. Try to adjust the wires so that they are not twisting or pulling on the electrodes.
Prepare to collect data when the subject is relaxing his/her bicep muscle and when he/she is flexing the muscle. A good technique for flexing the muscle is to lift up on the table. Whether flexing or relaxing the muscle, try to stay as stationary as possible.
Describe the behavior of the data for this
muscle and paste the graph into your log. Are you convinced
that this muscle generates a voltage when it is flexed?
Explain!
How is the signal from the bicep muscle
similar to or different from the signal from the heart muscle?
Activity
The concept of work
 (a) The work W done on an object by a
constant force is defined as W = F∙d. It is equal to the magnitude
of the force, multiplied by the distance the object moves in the direction of
the force.
(a) The work W done on an object by a
constant force is defined as W = F∙d. It is equal to the magnitude
of the force, multiplied by the distance the object moves in the direction of
the force.
The SI unit of work is Nm = J.
An object travels from point A to point B while two constant forces of equal
magnitude are exerted on it, as shown in the figure on the right.
 (b) An object travels
from point A to point B while two constant forces of
unequal magnitude are exerted on it, as shown in the figure on the right.
(b) An object travels
from point A to point B while two constant forces of
unequal magnitude are exerted on it, as shown in the figure on the right.
Work and the electric field
 In the diagram on the right the red dot
denotes a positive point charge. Points W, X, Y, and Z and the point
charge lie in the same plane. Points W and Y are equidistant from the
charge, as are points X and Z.
In the diagram on the right the red dot
denotes a positive point charge. Points W, X, Y, and Z and the point
charge lie in the same plane. Points W and Y are equidistant from the
charge, as are points X and Z.
Draw the electric field vectors at points W, X, Y, and Z.
(c) A particle with charge +qe travels along a straight line from
point W to point X.
(d) A particle travels from point X to point Z along the circular arc shown.
Electric potential difference
A potential energy function is a function of the
position of an object. It can only be defined for
conservative forces. A force is
conservative if the work it does on an object depends only on the initial and
final position of the object and not on the path.
(e)
Suppose the moving charge in part (c)
increases from +qe to +1.8 qe.
(f) The electric potential difference ∆VWX between two points W and X is defined to be the negative of the work done by the electric field on a charge q, divided by q, as q travels from W to X.
When a net force does work on an object, its
kinetic energy changes.
Wnet = ½m(vf2 - vi2)
= ∆K.
(g) A particle of charge |qe| = 3*10-6 C and mass m = 3*10-8 kg
is released from rest at point W. The speed of the particle is measured to be
30 m/s as it passes point X.
(h) Assume you have a test charge at rest at a distance of 2 cm from the charge on the right. You want to move it.
What path could you choose, so you would not have to do any work? What is the shape of the equipotential surface? (Remember that in general you can move in three dimensions.) Explain your reasoning.
 (i)
Find some equipotential surfaces for the charge
configuration shown on the right, which consists of two charged metal
plates placed parallel to each other.
(i)
Find some equipotential surfaces for the charge
configuration shown on the right, which consists of two charged metal
plates placed parallel to each other.
What is the shape of the equipotential surfaces? Remember you are trying to decide how a test charge could move so that the electric field does no work on it. Sketch your predictions and explain your reasoning.
 (j) Find some equipotential surfaces for the electric
dipole charge configuration shown on the right.
(j) Find some equipotential surfaces for the electric
dipole charge configuration shown on the right.
Sketch your predictions and explain your reasoning.
(k) Review these 3-dimensionl representations of equipotential sufaces and field lines.
Choose several different configurations.
Do these 3D representations help you visualize the relationship between electric field lines and equipotential surfaces?
Convert your log into a lab report. See the grading scheme for all lab reports.
Name:
E-mail address:
Laboratory 2 Report
Save your Word document (your name_lab2.docx), go to Canvas, Assignments, Lab 2, and submit your document.